Code
number_reps <- targets::tar_read(config_list)[[1]][["settings"]][["n_reps_graph"]]We summarized participant characteristics within strata defined by race–gender. Gathering characteristics were categorized by sexual contact and distance from home and summarized.
Spatial patterns: To visualize patterns of movement across the city, we categorized gatherings in terms of the containing community district and home community district and plotted the frequencies as a matrix.
Spatial concentration: To identify which districts tended to receive participants and which tended to send participants, we calculated the difference between the proportion of gatherings and the proportion of residences in each community district.
Spatial mixing coefficient: Finally, we computed the spatial mixing coefficient for subgroups defined by age, sexual orientation, and race–gender to quantify how these groups interacted across space. This measure quantifies the extent to which individuals from one group tend to live or gather in the same community districts as individuals from another group.
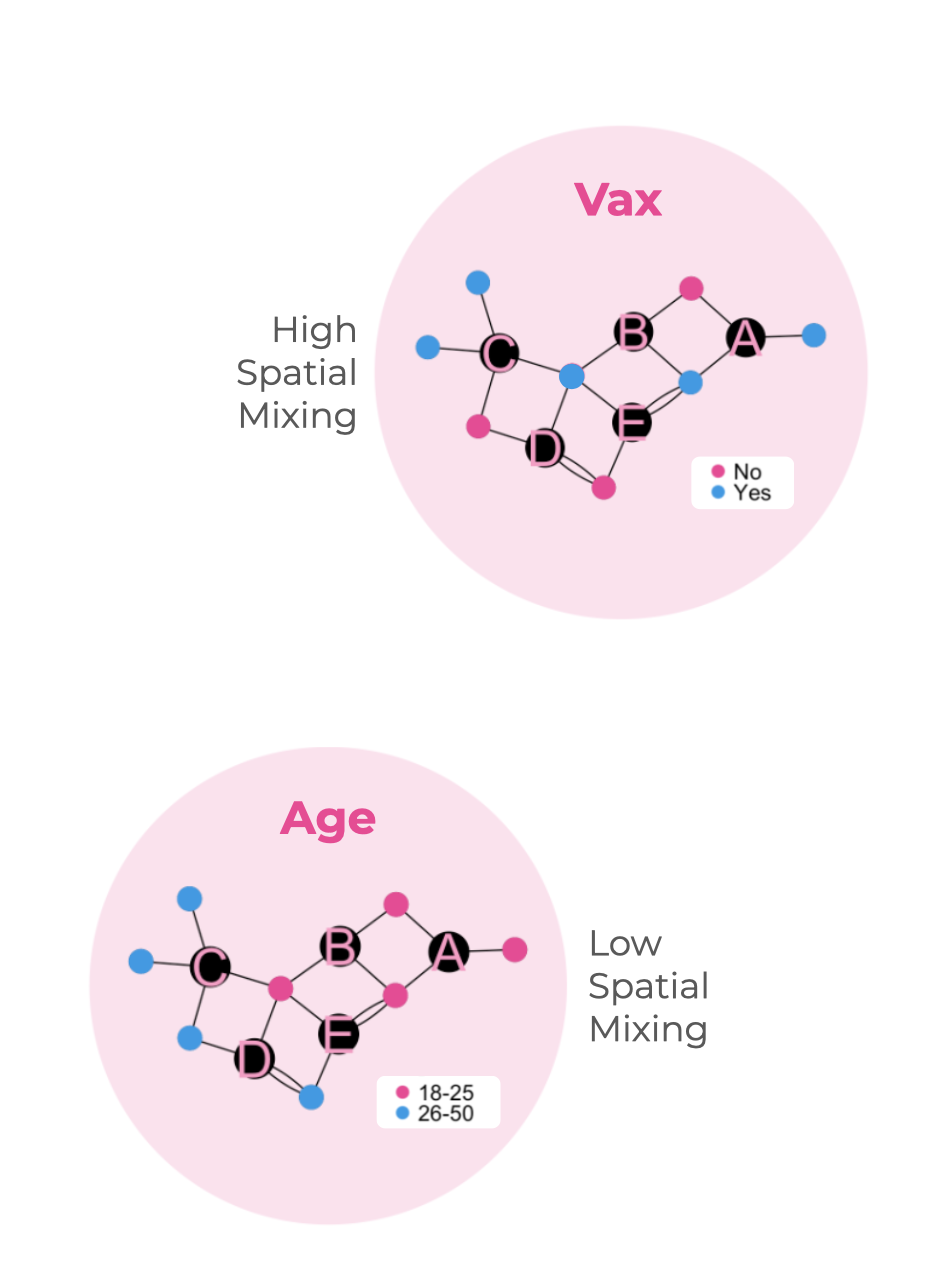
The spatial mixing ratio is a positive real number greater than 1 when members of the first subgroup are more likely than random to share community districts with members of the second subgroup, and between 0 and 1 otherwise. It is calculated as the average (across all individuals) of each person’s spatial preference for the second group divided by the second group’s overall prevalence in the sample. Preference is defined as the number of connections to individuals of the second subgroup as a proportion of total number of connections. The spatial mixing coefficient is the spatial mixing ratio minus one.
We modeled a hypothetical intervention in which community districts are immunized sequentially according to a priority ranking. To immunize a district is to immunize all individuals who had either a residence or a gathering in that district. Once immunized, individuals were assumed to be fully protected from acquiring or transmitting infection. Each person can only be immunized once.
We evaluated two alternative strategies for ranking community districts for vaccination: a contact-neutralizing strategy, and a movement-neutralizing strategy.
In the contact-neutralizing strategy, community districts were ranked by social catchment (the number of gatherings and residences they contained), counting only residences of participants who reported group contact and had not yet been immunized. This approach prioritizes districts with the highest concentration of sexual or physical contact, aiming to immunize as many individuals as possible while focusing on a minimal number of locations.
In the movement-neutralizing strategy, community districts were ranked according to their spatial catchment —- a measure of how strongly each district is connected to others across the city. This strategy prioritizes districts that function as spatial hubs for participant movement, targeting them early in the immunization sequence to contain potential city-wide spread.
Each time a community district is immunized, we recalculate two key outcome measures: spatial efficiency and spatial network impact, each reflecting a different dimension of intervention performance.
Spatial efficiency is defined as the total number of immunized individuals divided by the number of community districts immunized. To compare the two intervention strategies, we visualized the number of community districts required to immunize approximately 33% and 66% of the total population.
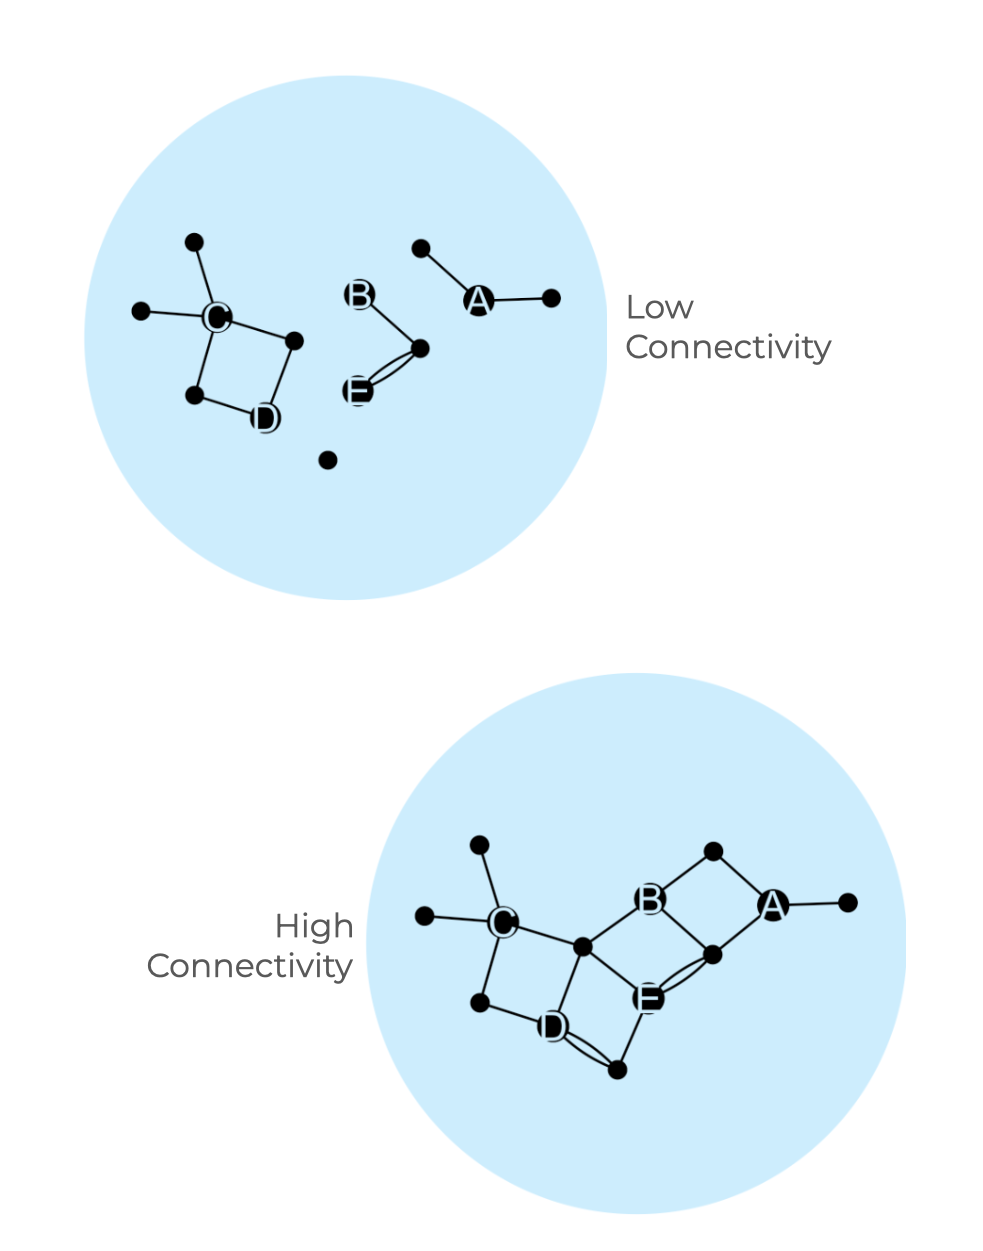
Spatial network impact is defined as the proportion of individuals belonging to the largest connected component of the network. This measure reflects the extent to which susceptible individuals remain embedded within the same transmission-relevant network after each intervention step. To compare strategies, we plotted, for each additional community district immunized, the proportions of individuals who were immunized, susceptible and still within the largest component, and susceptible but outside of the largest component.
The proportion of all nodes contained in the LCC serves as a measure of how cohesively the network is connected: a larger LCC indicates greater overall connectedness among participants.
number_reps <- targets::tar_read(config_list)[[1]][["settings"]][["n_reps_graph"]]To quantify uncertainty around our network-based estimates, we used the bootstrap to calculate confidence intervals, assuming that the underlying data are a realization of a Bipartite Random Network Finest Fully Randomized Causally Interpretable Structured Tree Graph (BRNFFRCISTG) model (see Section C.3).
Recalling that the MPX NYC person-place graph includes participant observations and community district observations as nodes, we resampled participant observations 1000 times with replacement. An observation was defined as the complement of measures on a particular participant as well as all the edges that connect that participant to their community districts of residence and gatherings.
This approach provides robust, nonparametric inference by repeatedly drawing samples from the observed data to approximate sampling variability.