Code
targets::tar_read(plotdata_racegender) |>
  plot_bar() +
  theme_mpxnyc_bar() +
  scale_axis_mpxnyc() +
  scale_fill_mpxnyc(name = "Race / gender") +
  theme_mpxnyc_nomargin()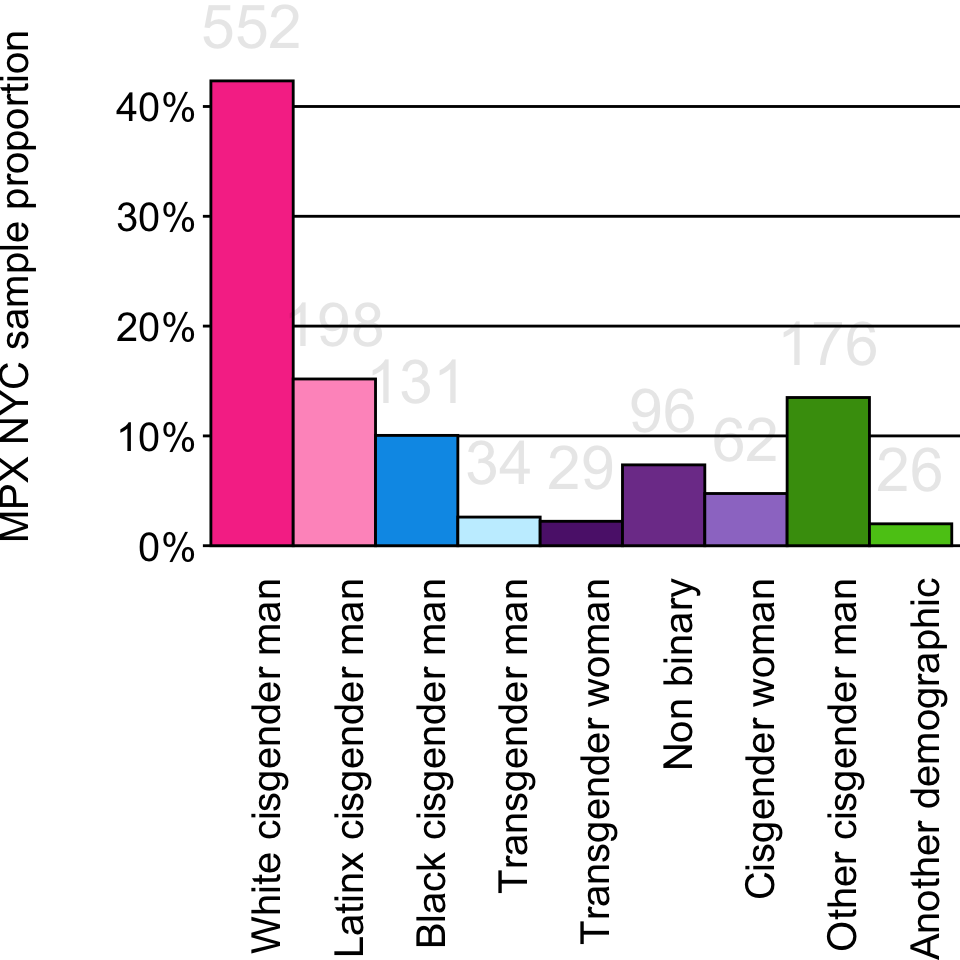
targets::tar_read(plotdata_racegender) |>
plot_bar() +
theme_mpxnyc_bar() +
scale_axis_mpxnyc() +
scale_fill_mpxnyc(name = "Race / gender") +
theme_mpxnyc_nomargin()
targets::tar_read(plotdata_race)  |>
  plot_bar()  +
  theme_mpxnyc_bar() +
  scale_axis_mpxnyc() +
  scale_fill_mpxnyc(name = "Race") +
  theme_mpxnyc_nomargin()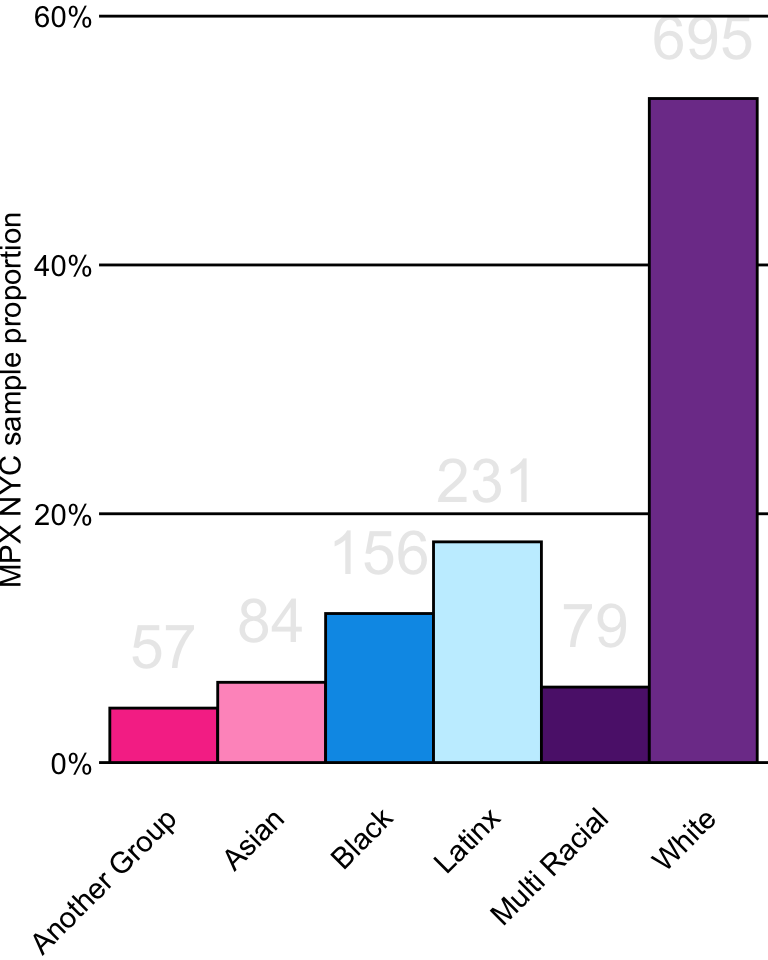
targets::tar_read(plotdata_genderid) |>
  plot_bar() +
  theme_mpxnyc_bar() +
  scale_axis_mpxnyc("MPX NYC sample proportion") +
  scale_fill_mpxnyc(name = "Gender\nmodality") +
    theme_mpxnyc_nomargin()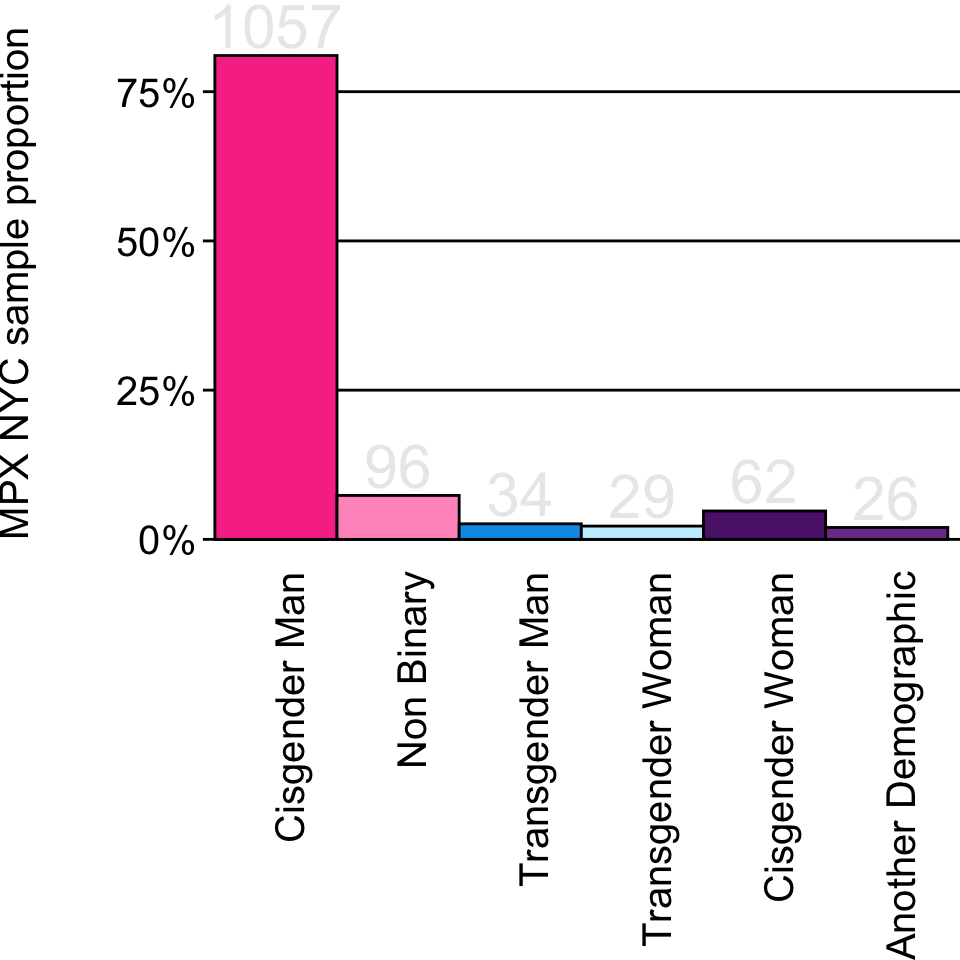
How old are you?
  targets::tar_read(plotdata_age) |>
    plot_bar() +
    theme_mpxnyc_bar() +
    scale_axis_mpxnyc() +
    scale_fill_mpxnyc(name = "Age group") +
    theme_mpxnyc_nomargin()
targets::tar_read(plotdata_age_racegender) |>
  plot_radar_grid()  +
  scale_radial_mpxnyc() +
  scale_fill_mpxnyc(name = "") +
  theme_mpxnyc_radar_people() +
  theme_mpxnyc_nomargin()
What is your sexual orientation?
targets::tar_read(plotdata_sexorientation)  |>
  plot_bar()  +
  theme_mpxnyc_bar() +
  scale_axis_mpxnyc() +
  scale_fill_mpxnyc(name = "Sexual orientation") +
  theme_mpxnyc_nomargin()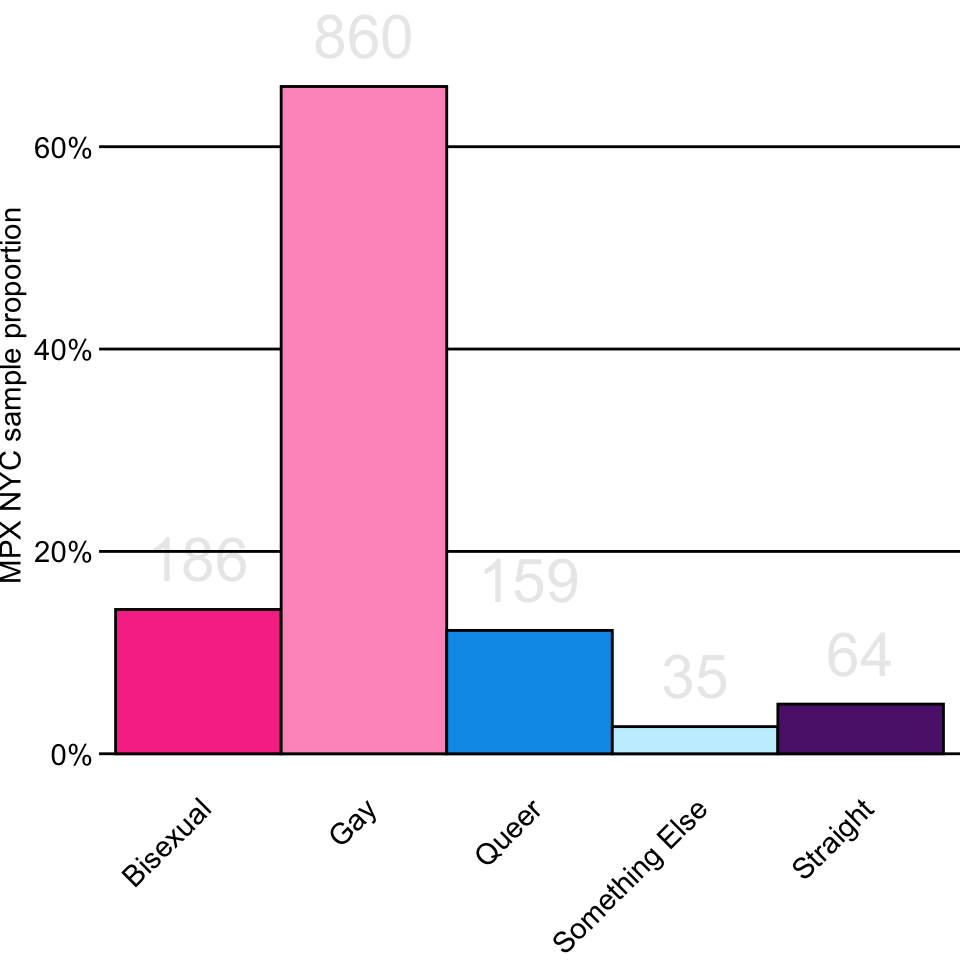
targets::tar_read(plotdata_sexorientation_racegender) |>
  plot_radar_grid()  +
  scale_radial_mpxnyc() +
  scale_fill_mpxnyc(name = "") +
  theme_mpxnyc_radar_people() +
  theme_mpxnyc_nomargin()
targets::tar_read(plotdata_channel) |>
  plot_bar()  +
  theme_mpxnyc_bar() +
  scale_axis_mpxnyc() +
  scale_fill_mpxnyc(name = "Recruitment\nchannel") +
    theme_mpxnyc_nomargin()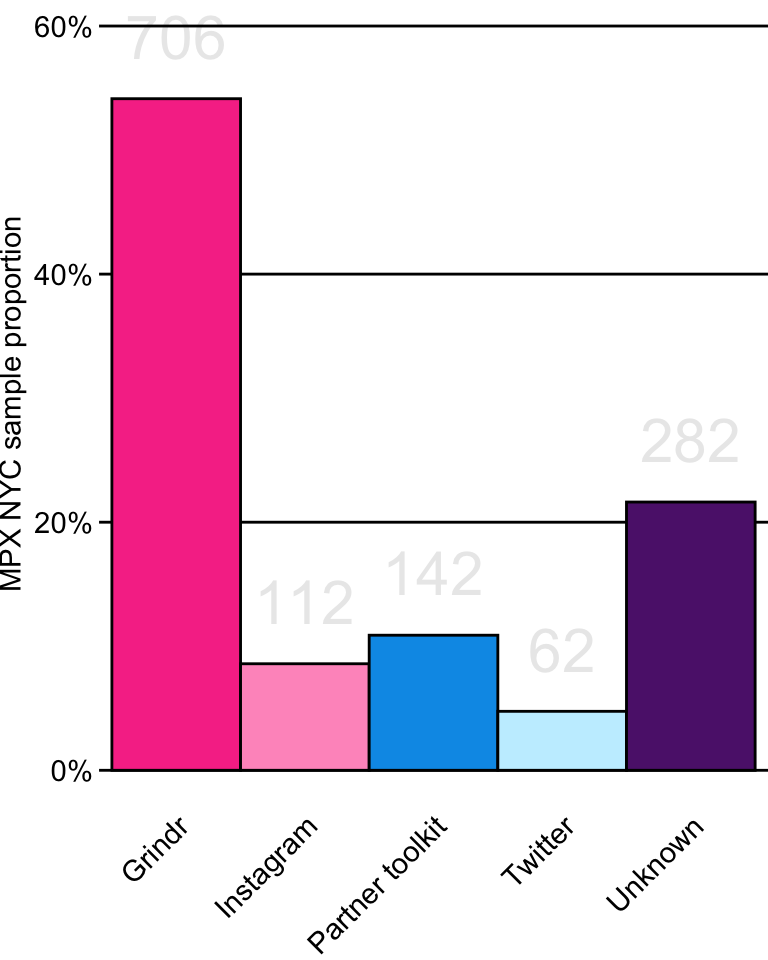
targets::tar_read(plotdata_channel_racegender) |>
  plot_radar_grid()  +
  scale_radial_mpxnyc() +
  scale_fill_mpxnyc(name = "") +
  theme_mpxnyc_radar_people() +
  theme_mpxnyc_nomargin()
Are you on PrEP?
  targets::tar_read(plotdata_hivprep) |>
    plot_bar() +
    theme_mpxnyc_bar() +
    scale_axis_mpxnyc() +
    scale_fill_mpxnyc(name = "Age group") +
    theme_mpxnyc_nomargin()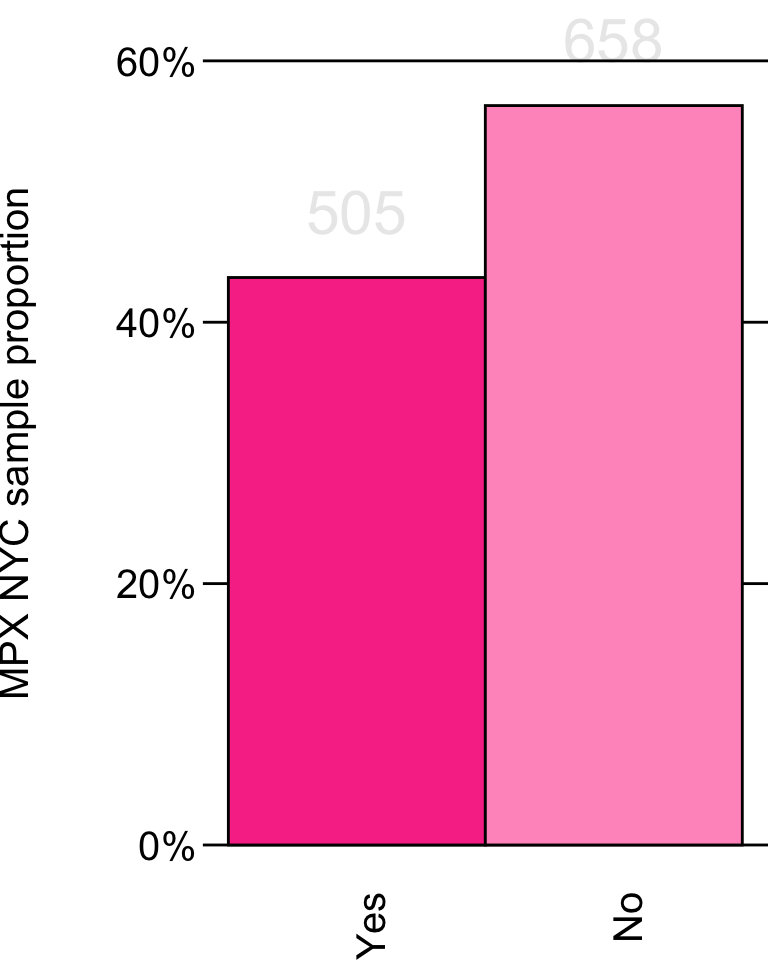
targets::tar_read(plotdata_hivprep_racegender) |>
  plot_radar_grid()  +
  scale_radial_mpxnyc() +
  scale_fill_mpxnyc(name = "") +
  theme_mpxnyc_radar_people() +
  theme_mpxnyc_nomargin()
What is your HIV status?
  targets::tar_read(plotdata_hivstatus) |>
    plot_bar() +
    theme_mpxnyc_bar() +
    scale_axis_mpxnyc() +
    scale_fill_mpxnyc(name = "HIV status") +
    theme_mpxnyc_nomargin()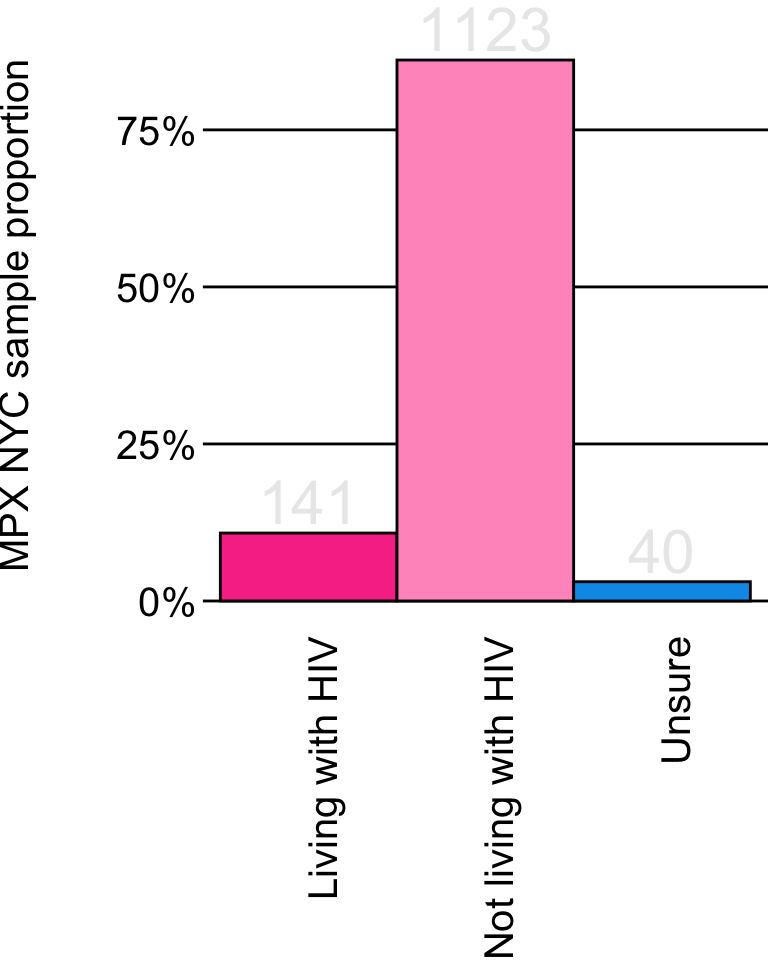
targets::tar_read(plotdata_hivstatus_racegender) |>
  plot_radar_grid()  +
  scale_radial_mpxnyc() +
  scale_fill_mpxnyc(name = "") +
  theme_mpxnyc_radar_people() +
  theme_mpxnyc_nomargin()
Have you been told that your viral load is suppressed or undetectable?
  targets::tar_read(plotdata_hivsuppressed) |>
    plot_bar() +
    theme_mpxnyc_bar() +
    scale_axis_mpxnyc() +
    scale_fill_mpxnyc(name = "HIV status") +
    theme_mpxnyc_nomargin()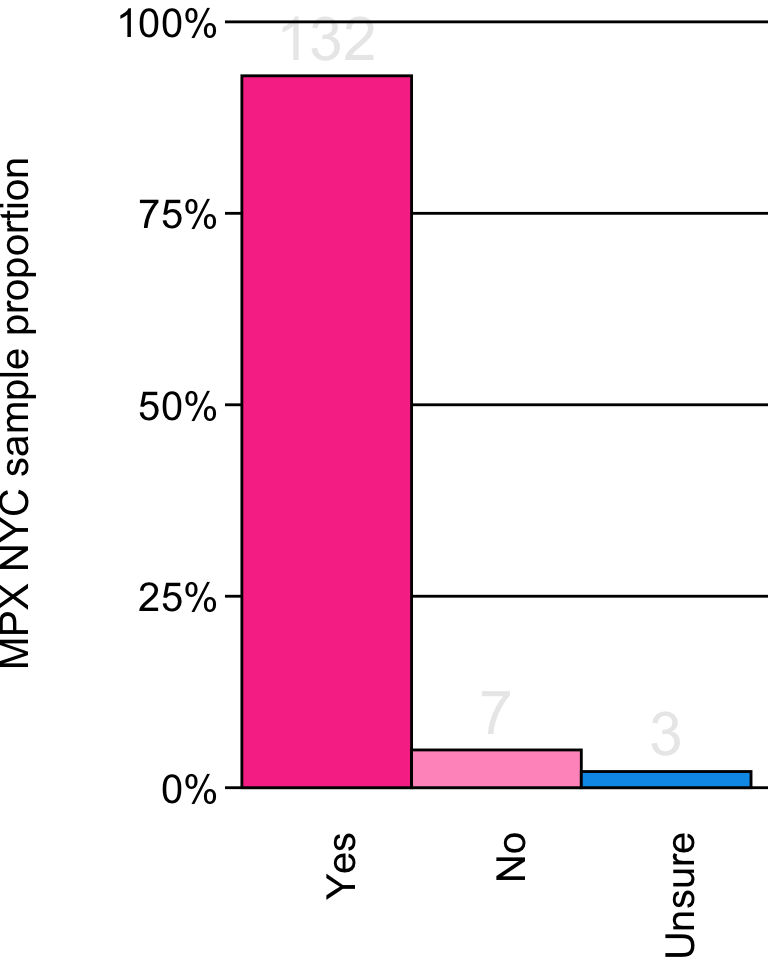
targets::tar_read(plotdata_hivsuppressed_racegender) |>
  plot_radar_grid()  +
  scale_radial_mpxnyc() +
  scale_fill_mpxnyc(name = "") +
  theme_mpxnyc_radar_people() +
  theme_mpxnyc_nomargin()
Did you receive care by a medical provider for your symptoms?
  targets::tar_read(plotdata_mpoxcare) |>
    plot_bar() +
    theme_mpxnyc_bar() +
    scale_axis_mpxnyc() +
    scale_fill_mpxnyc(name = "Mpox care") +
    theme_mpxnyc_nomargin()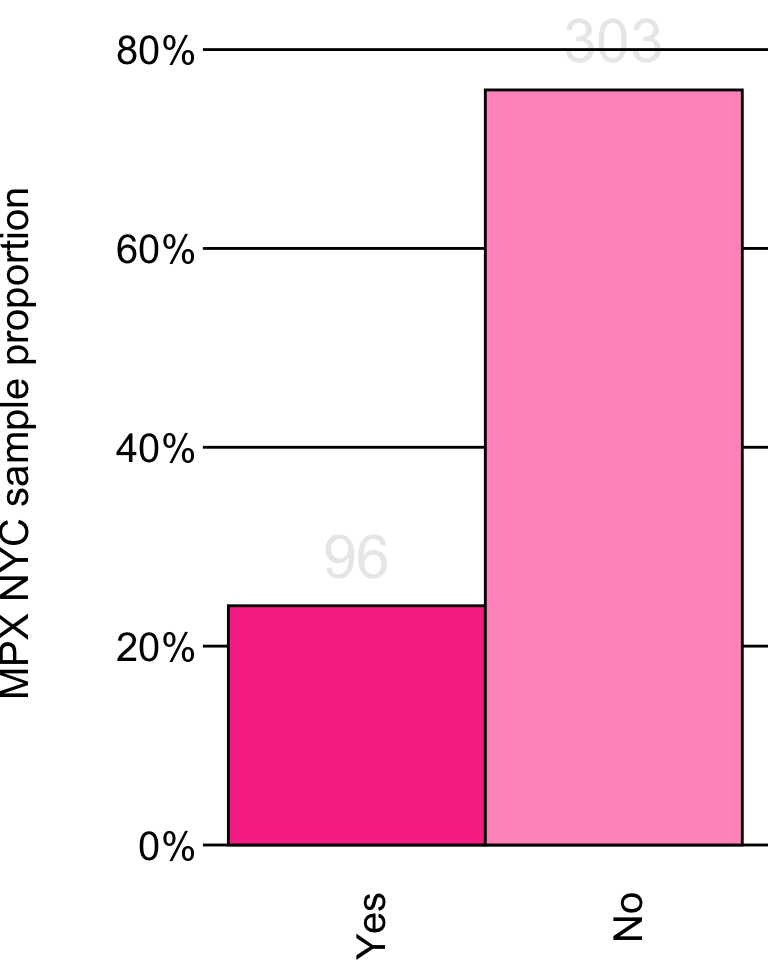
targets::tar_read(plotdata_mpoxcare_racegender) |>
  plot_radar_grid()  +
  scale_radial_mpxnyc() +
  scale_fill_mpxnyc(name = "") +
  theme_mpxnyc_radar_people() +
  theme_mpxnyc_nomargin()
In the past 4 weeks, did you receive testing for mpox?
  targets::tar_read(plotdata_mpoxtest) |>
    plot_bar() +
    theme_mpxnyc_bar() +
    scale_axis_mpxnyc() +
    scale_fill_mpxnyc(name = "Mpox test") +
    theme_mpxnyc_nomargin()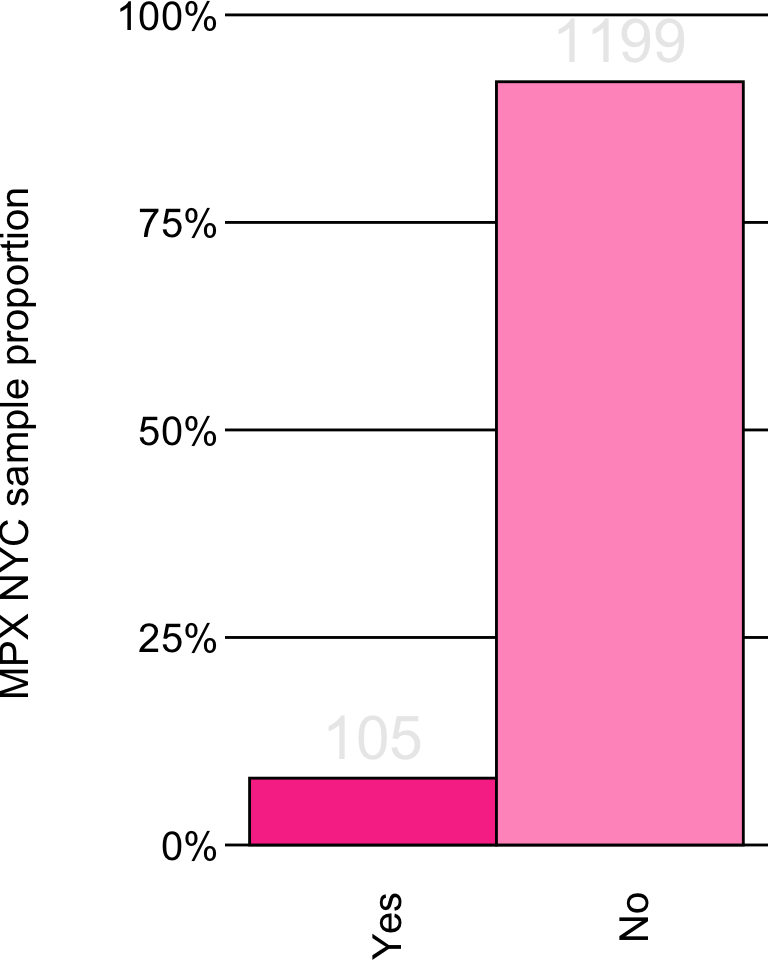
targets::tar_read(plotdata_mpoxtest_racegender) |>
  plot_radar_grid()  +
  scale_radial_mpxnyc() +
  scale_fill_mpxnyc(name = "") +
  theme_mpxnyc_radar_people() +
  theme_mpxnyc_nomargin()
In the past 4 weeks, did you test positive for COVID-19?
  targets::tar_read(plotdata_covidtestpositive) |>
    plot_bar() +
    theme_mpxnyc_bar() +
    scale_axis_mpxnyc() +
    scale_fill_mpxnyc(name = "Response") +
    theme_mpxnyc_nomargin()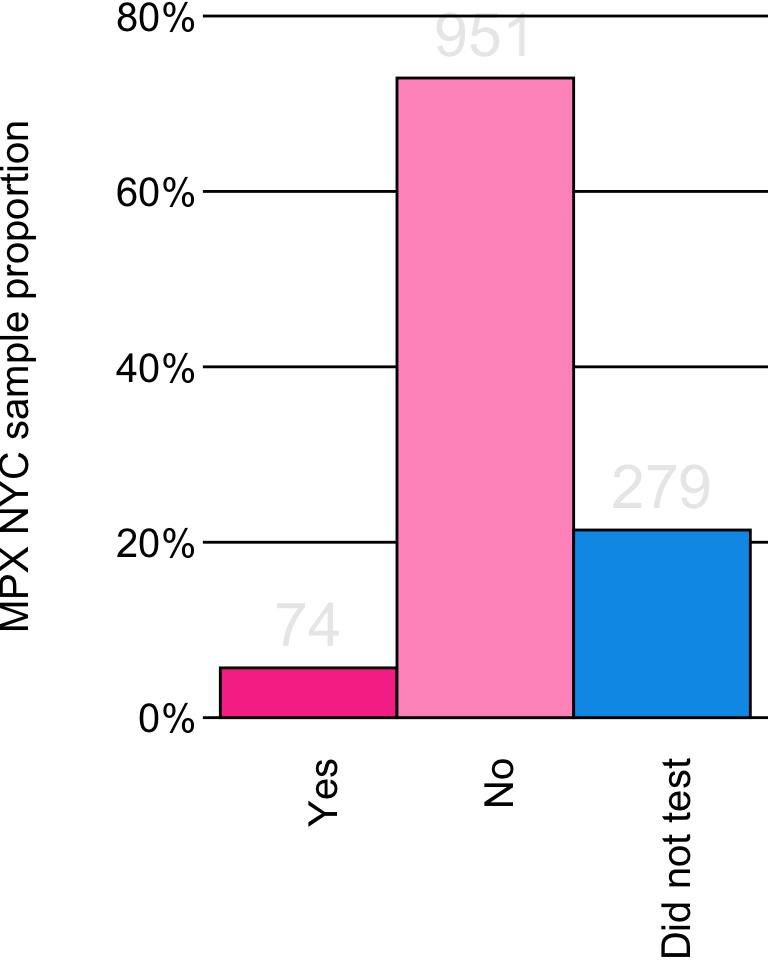
targets::tar_read(plotdata_covidtestpositive_racegender) |>
  plot_radar_grid()  +
  scale_radial_mpxnyc() +
  scale_fill_mpxnyc(name = "") +
  theme_mpxnyc_radar_people() +
  theme_mpxnyc_nomargin()
Number of symptoms (calculated)
  targets::tar_read(plotdata_stisymptoms) |>
    plot_bar() +
    theme_mpxnyc_bar() +
    scale_axis_mpxnyc() +
    scale_fill_mpxnyc(name = "HIV status") +
    theme_mpxnyc_nomargin()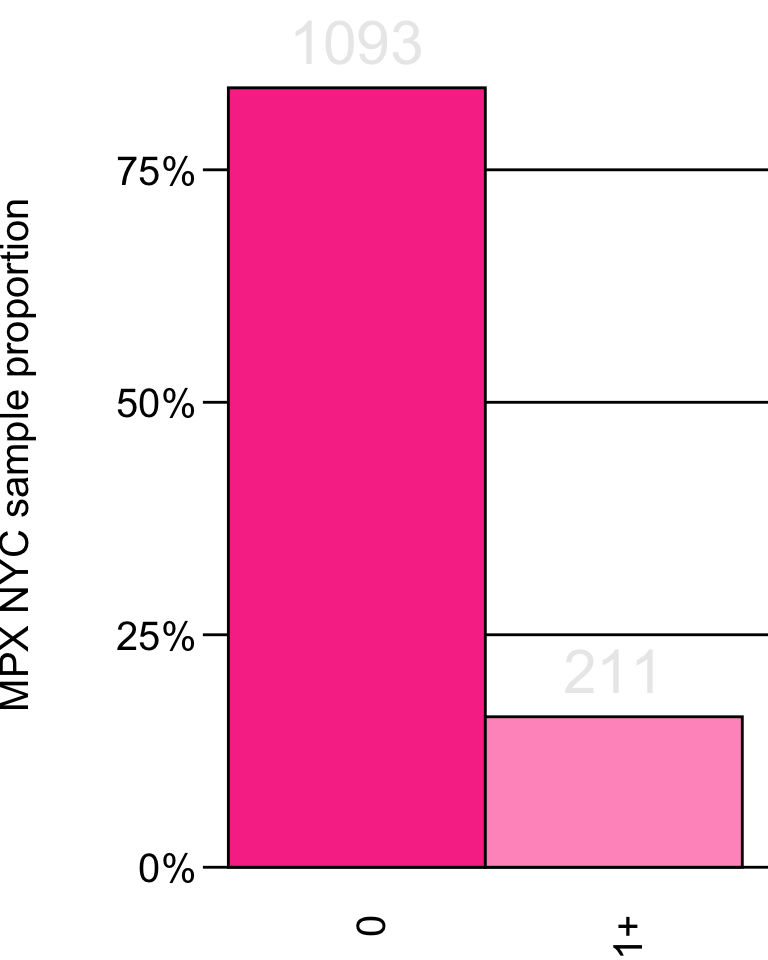
targets::tar_read(plotdata_stisymptoms_racegender) |>
  plot_radar_grid()  +
  scale_radial_mpxnyc() +
  scale_fill_mpxnyc(name = "") +
  theme_mpxnyc_radar_people() +
  theme_mpxnyc_nomargin()
How many queer and trans friends do you have who are important to you for any reason? Count only those you have been in touch with over the past 4 weeks.
  targets::tar_read(plotdata_countfriends) |>
    plot_bar() +
    theme_mpxnyc_bar() +
    scale_axis_mpxnyc() +
    scale_fill_mpxnyc(name = "Count") +
    theme_mpxnyc_nomargin()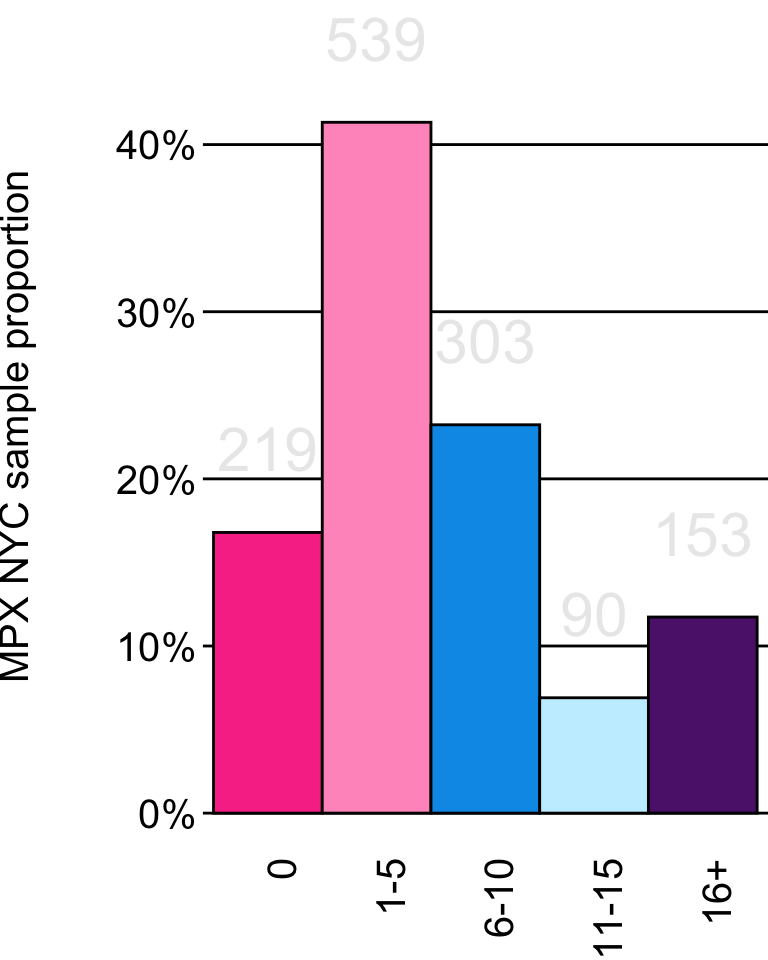
targets::tar_read(plotdata_countfriends_racegender) |>
  plot_radar_grid()  +
  scale_radial_mpxnyc() +
  scale_fill_mpxnyc(name = "") +
  theme_mpxnyc_radar_people() +
  theme_mpxnyc_nomargin()
How many individuals have you had prolonged physical contact (but no sexual contact) with in the past 4 weeks, excluding group settings?
  targets::tar_read(plotdata_countphysical) |>
    plot_bar() +
    theme_mpxnyc_bar() +
    scale_axis_mpxnyc() +
    scale_fill_mpxnyc(name = "Count") +
    theme_mpxnyc_nomargin()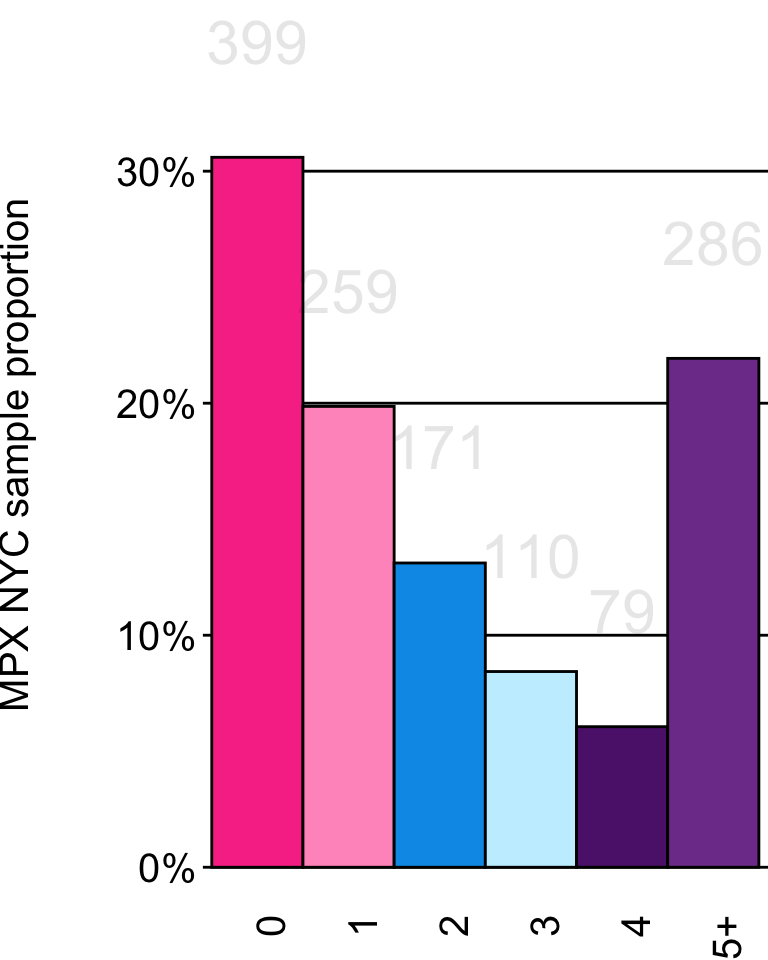
targets::tar_read(plotdata_countphysical_racegender) |>
  plot_radar_grid()  +
  scale_radial_mpxnyc() +
  scale_fill_mpxnyc(name = "") +
  theme_mpxnyc_radar_people() +
  theme_mpxnyc_nomargin()
How many individuals have you had sex with in the past 4 weeks, excluding group sex partners?
  targets::tar_read(plotdata_countsex) |>
    plot_bar() +
    theme_mpxnyc_bar() +
    scale_axis_mpxnyc() +
    scale_fill_mpxnyc(name = "Count") +
    theme_mpxnyc_nomargin()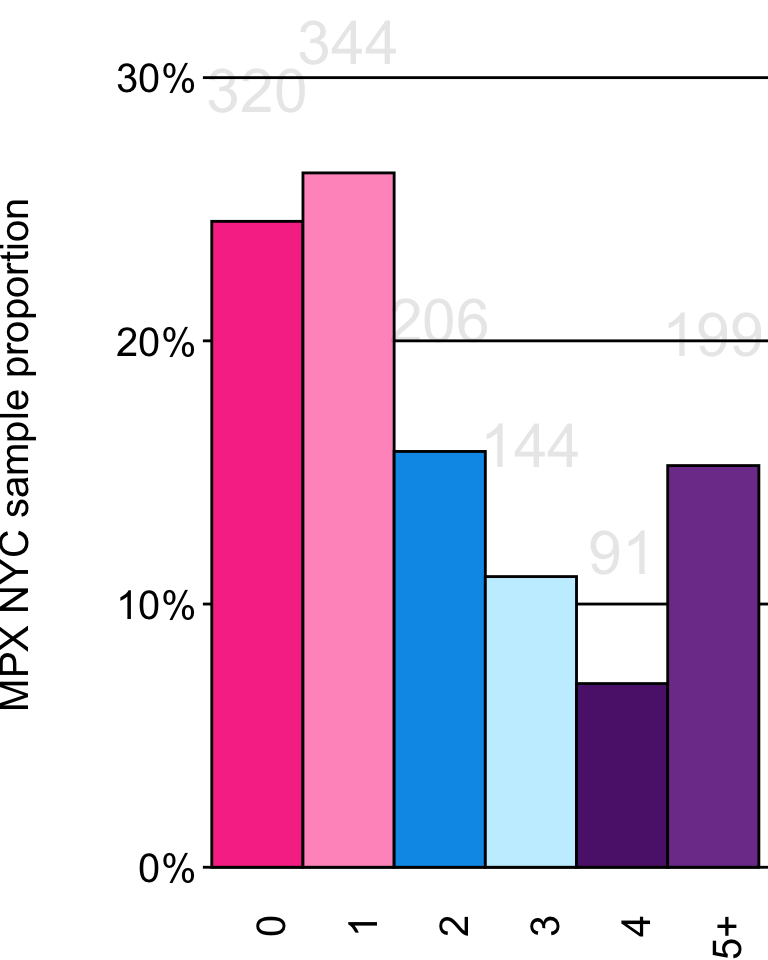
targets::tar_read(plotdata_countsex_racegender) |>
  plot_radar_grid()  +
  scale_radial_mpxnyc() +
  scale_fill_mpxnyc(name = "") +
  theme_mpxnyc_radar_people() +
  theme_mpxnyc_nomargin()
Over the past 4 weeks, have you had sex with two or more people at the same time or had close physical contact with multiple people at the same time? (like at a party, sport game, concert, show)
  targets::tar_read(plotdata_groupsex) |>
    plot_bar() +
    theme_mpxnyc_bar() +
    scale_axis_mpxnyc() +
    scale_fill_mpxnyc(name = "Count") +
    theme_mpxnyc_nomargin()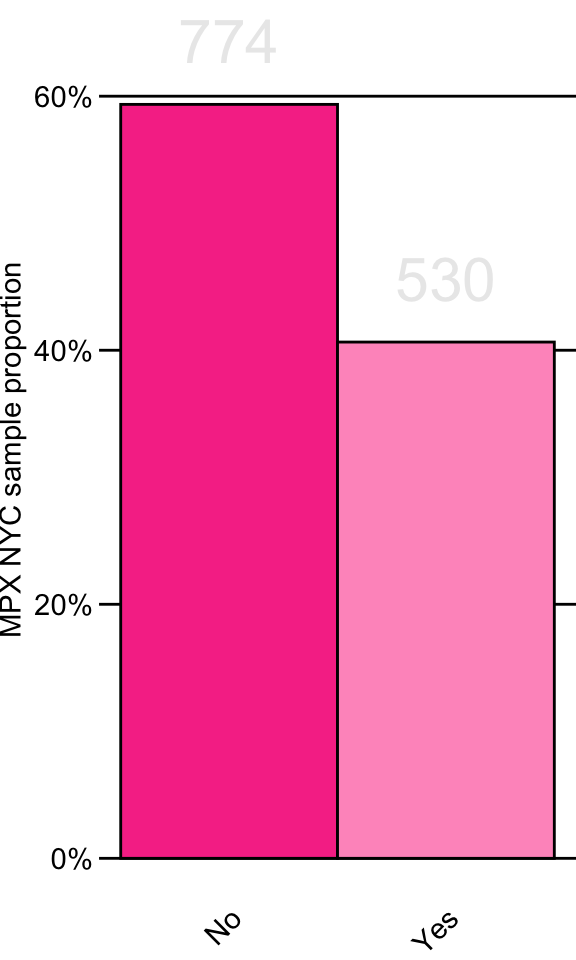
targets::tar_read(plotdata_groupsex_racegender) |>
  plot_radar_grid()  +
  scale_radial_mpxnyc() +
  scale_fill_mpxnyc(name = "") +
  theme_mpxnyc_radar_people() +
  theme_mpxnyc_nomargin()
By the way, how long are you willing to travel to hook up?
  targets::tar_read(plotdata_traveltime) |>
    plot_bar() +
    theme_mpxnyc_bar() +
    scale_axis_mpxnyc() +
    scale_fill_mpxnyc(name = "Place type") +
    theme_mpxnyc_nomargin()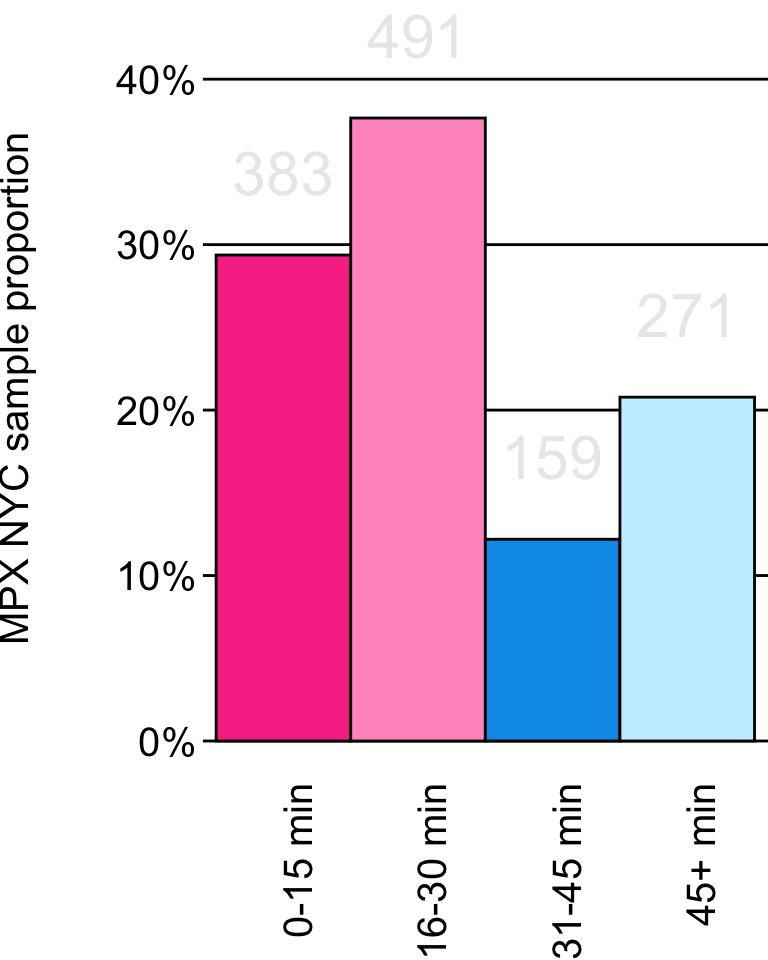
targets::tar_read(plotdata_traveltime_racegender) |>
  plot_radar_grid()  +
  scale_radial_mpxnyc() +
  scale_fill_mpxnyc(name = "") +
  theme_mpxnyc_radar_people() +
  theme_mpxnyc_nomargin()
targets::tar_read(plotdata_place_census_overall)  |>
  plot_placecensus_map() +
  scale_fill_mpxnyc(name = "", na.translate = FALSE, option = "light") +
  theme_mpxnyc_blank(
                      legend.position = "bottom",
                      strip.text.y.left = ggplot2::element_text(size = 14, angle = 65, margin = ggplot2::margin(0,0,0,0), color = "#636363"),
                      strip.clip = "off"
) 
targets::tar_read(plotdata_place_census_racegender)  |>
  plot_placecensus_map() +
  scale_fill_mpxnyc(name = "", na.translate = FALSE, option = "light") +
  theme_mpxnyc_blank(
                      legend.position = "bottom",
                      strip.text.y.left = ggplot2::element_text(size = 14, angle = 65, margin = ggplot2::margin(0,0,0,0), color = "#636363"),
                      strip.clip = "off"
) 
  targets::tar_read(plotdata_placetype) |>
    plot_bar() +
    theme_mpxnyc_bar() +
    scale_axis_mpxnyc() +
    scale_fill_mpxnyc(name = "Place type") +
    theme_mpxnyc_nomargin()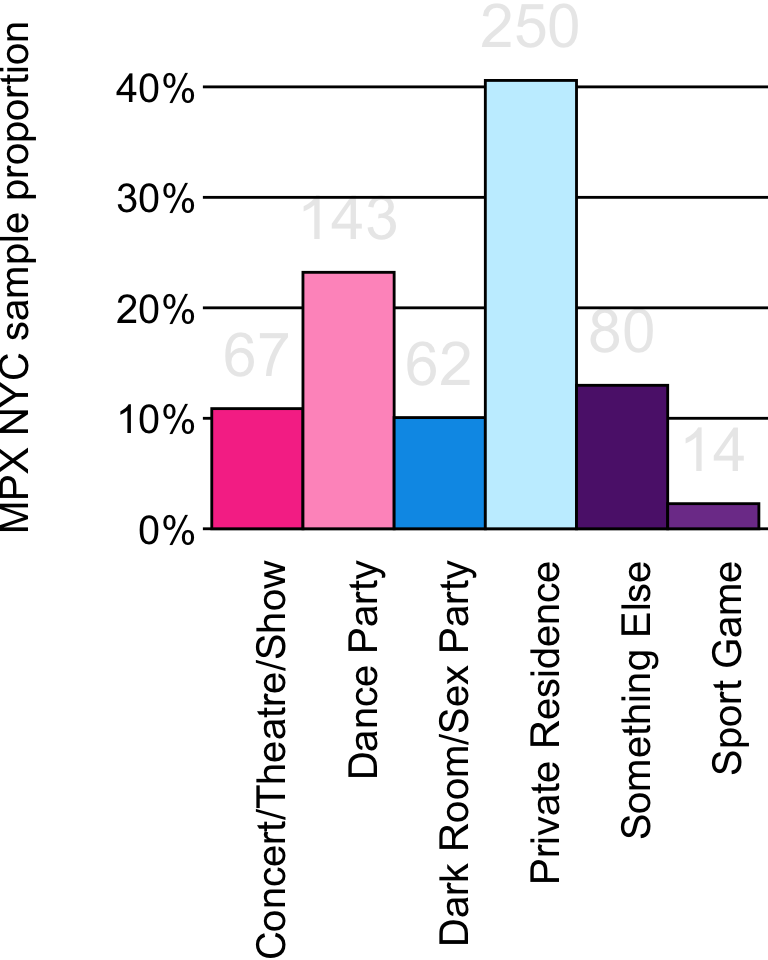
targets::tar_read(plotdata_placetype_placesex) |>
  dplyr::filter(stratum != "home") |>
  dplyr::mutate(stratum = factor(stratum, levels(stratum)[levels(stratum) != "home"])) |>
  plot_radar_grid() +
  scale_radial_mpxnyc() +
  scale_fill_mpxnyc(name = "") +
  theme_mpxnyc_radar_people() +
  theme_mpxnyc_nomargin()
targets::tar_read(plotdata_placetype_distancefromhome) |>
  dplyr::filter(stratum != "home") |>
  dplyr::mutate(stratum = factor(stratum, levels(stratum)[levels(stratum) != "home"])) |>
  plot_radar_grid()  +
  scale_radial_mpxnyc() +
  scale_fill_mpxnyc(name = "") +
  theme_mpxnyc_radar_people() +
  theme_mpxnyc_nomargin()
targets::tar_read(plotdata_placetype_bar_grid) |>
  dplyr::mutate(proportion = abs(proportion)) |>
  plot_bar_stratified2() +
    ggplot2::coord_polar() +
  scale_axis_mpxnyc() +
  ggplot2::scale_y_continuous(limits = c(-0.3, 0.84)) +
  scale_fill_mpxnyc(name = "") +
  ggplot2::geom_label(ggplot2::aes(label = scales::percent(proportion, accuracy = 1), x = level, y = 0.5 ), border.color = "white", label.size = 0, size = 3.5) +
  theme_mpxnyc_bar_places(
      plot.margin = ggplot2::unit(c(0,0,0,0), "cm"),
      panel.spacing = ggplot2::unit(0, "cm"),
      legend.position = "bottom",
      panel.grid.major.y = ggplot2::element_blank(),
      panel.grid.major.x = ggplot2::element_blank(),
      axis.text.x = ggplot2::element_blank(),
      strip.text.y.left = ggplot2::element_text(angle = 90)
      )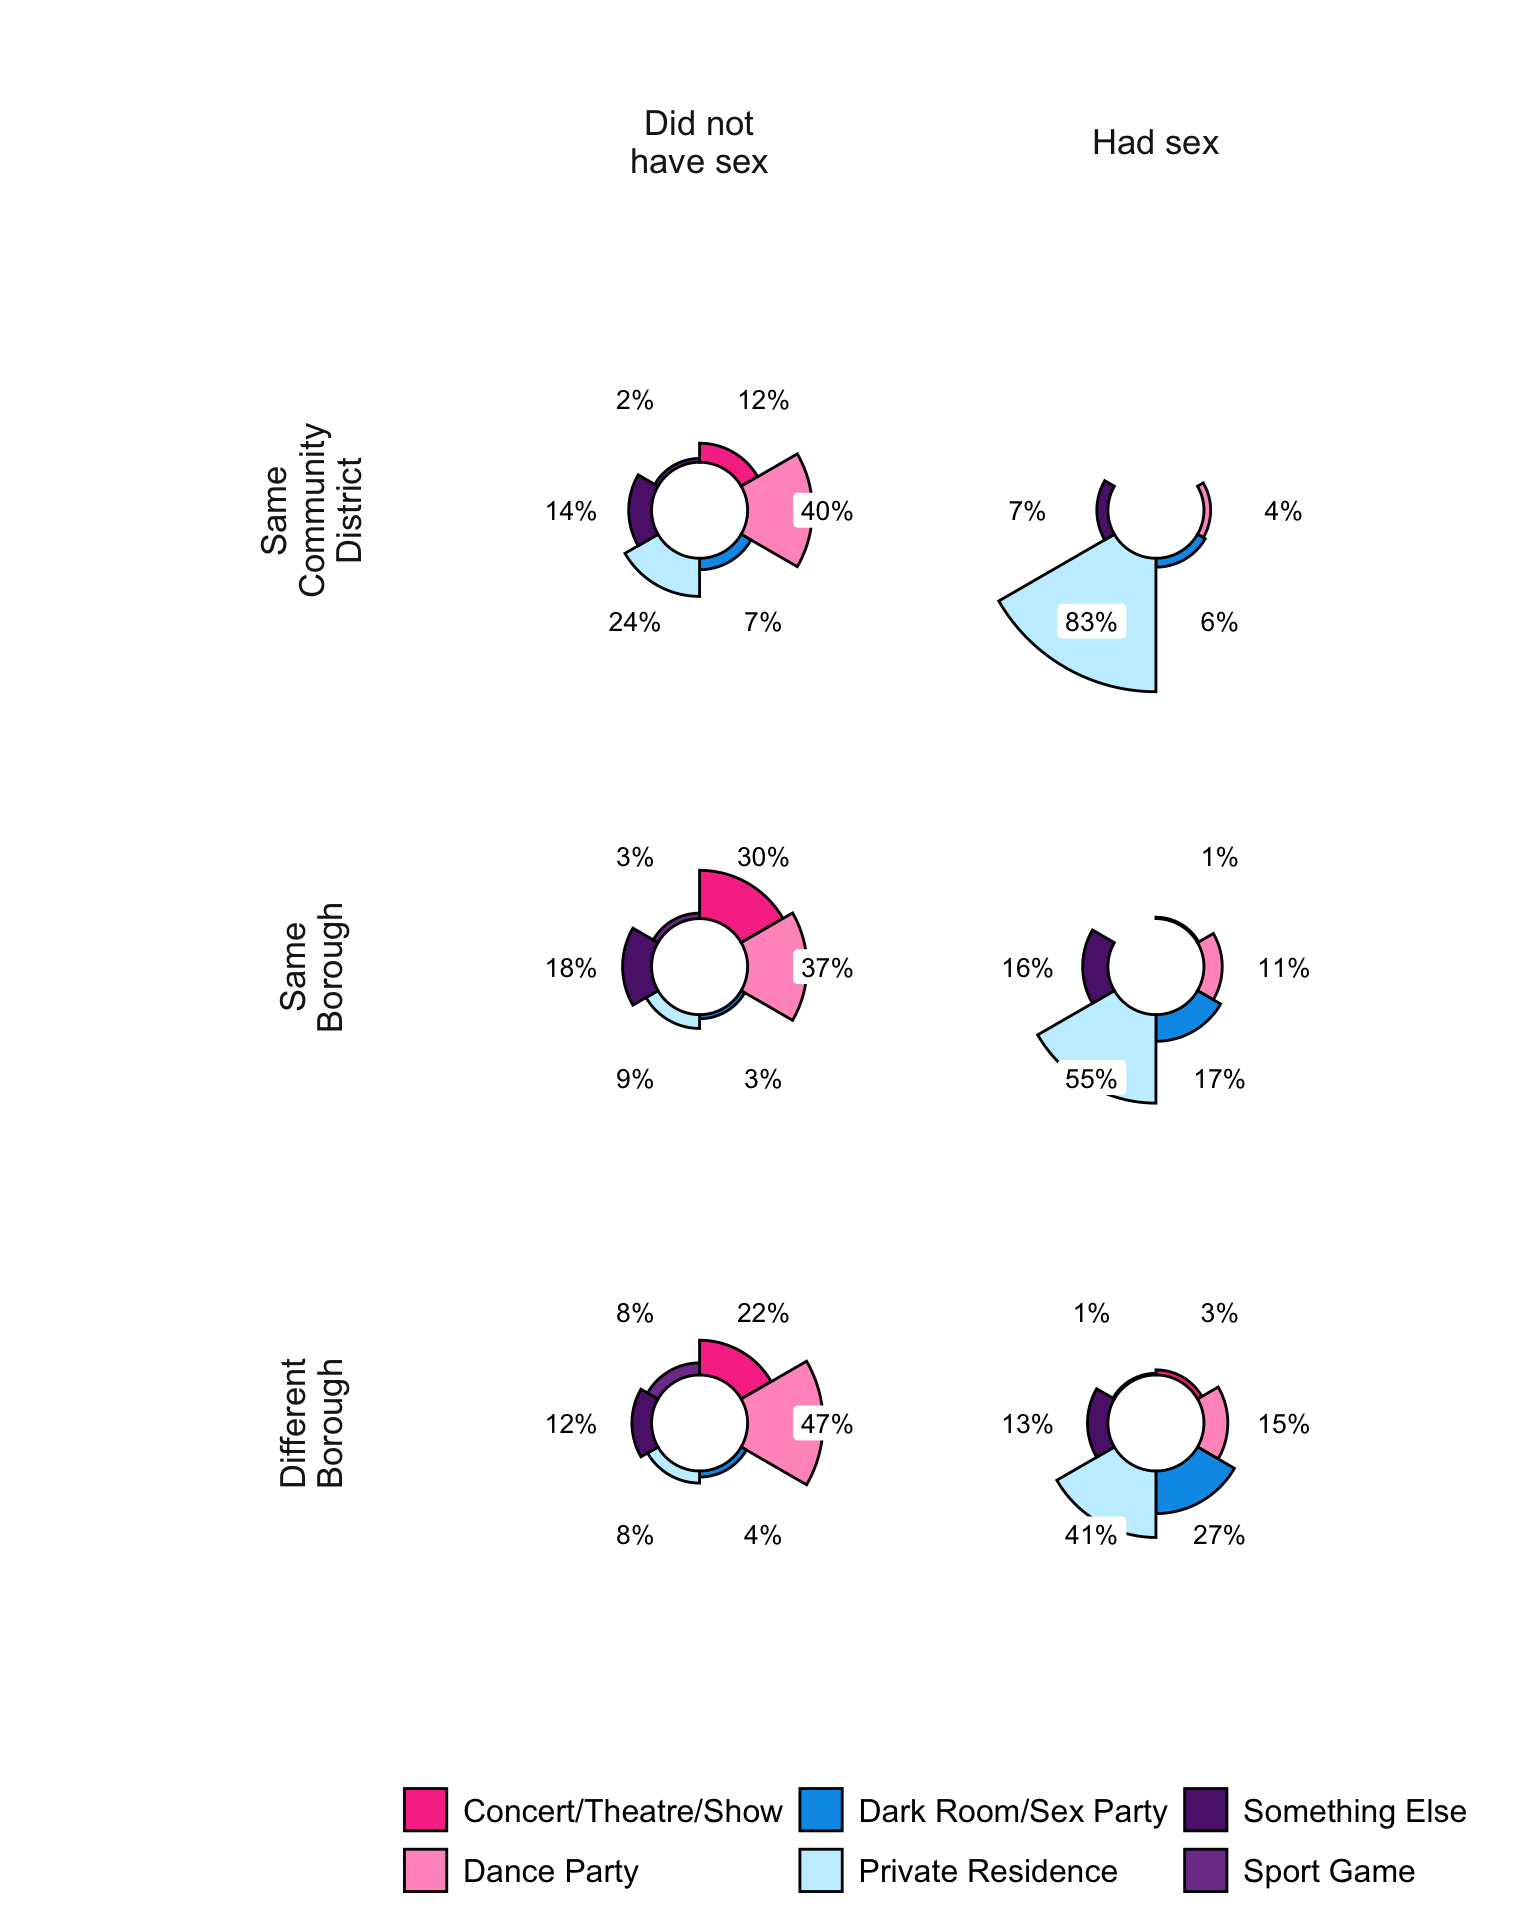
targets::tar_read(plotdata_placetype_distancefromhome_placeSex)  |>
draw_table_3("Venue type by home distance and sexual contact")| Venue type by home distance and sexual contact | ||
|---|---|---|
| (MPX NYC, 2022) | ||
| N | % (CI) | |
| Same Community District - Did not have sex | ||
| Concert/Theatre/Show | 5 | 12% (3-23) |
| Dark Room/Sex Party | 3 | 7% (2-16) |
| Private Residence | 10 | 24% (11-39) |
| Dance Party | 17 | 40% (25-56) |
| Sport Game | 1 | 2% (2-9) |
| Something Else | 6 | 14% (5-25) |
| Same Community District - Had sex | ||
| Dark Room/Sex Party | 8 | 6% (2-10) |
| Private Residence | 120 | 83% (77-89) |
| Dance Party | 6 | 4% (1-8) |
| Something Else | 10 | 7% (3-11) |
| Same Borough - Did not have sex | ||
| Concert/Theatre/Show | 35 | 30% (21-40) |
| Dark Room/Sex Party | 3 | 3% (1-6) |
| Private Residence | 10 | 9% (4-14) |
| Dance Party | 43 | 37% (29-47) |
| Sport Game | 4 | 3% (1-7) |
| Something Else | 21 | 18% (11-26) |
| Same Borough - Had sex | ||
| Concert/Theatre/Show | 1 | 1% (1-3) |
| Dark Room/Sex Party | 19 | 17% (10-24) |
| Private Residence | 63 | 55% (46-65) |
| Dance Party | 13 | 11% (6-17) |
| Something Else | 18 | 16% (10-22) |
| Different Borough - Did not have sex | ||
| Concert/Theatre/Show | 23 | 22% (14-30) |
| Dark Room/Sex Party | 4 | 4% (1-8) |
| Private Residence | 8 | 8% (3-14) |
| Dance Party | 50 | 47% (37-56) |
| Sport Game | 8 | 8% (3-13) |
| Something Else | 13 | 12% (6-19) |
| Different Borough - Had sex | ||
| Concert/Theatre/Show | 3 | 3% (1-7) |
| Dark Room/Sex Party | 25 | 27% (18-36) |
| Private Residence | 39 | 41% (30-53) |
| Dance Party | 14 | 15% (8-22) |
| Sport Game | 1 | 1% (1-4) |
| Something Else | 12 | 13% (6-21) |
targets::tar_read(plotdata_age_mixing_matrix) |>
  plot_matrix_mixing() +
  scale_fill_mpxnyc_gradient("Spatial\nmixing\ncoefficient", labels = scales::label_percent(), breaks = c(-0.5, 0, 0.5, 1), limits = c(-0.5, 1)) +
  scale_color_mpxnyc_gradient() +
  ggplot2::scale_alpha_discrete(guide = "none") +
theme_mpxnyc_mixing() 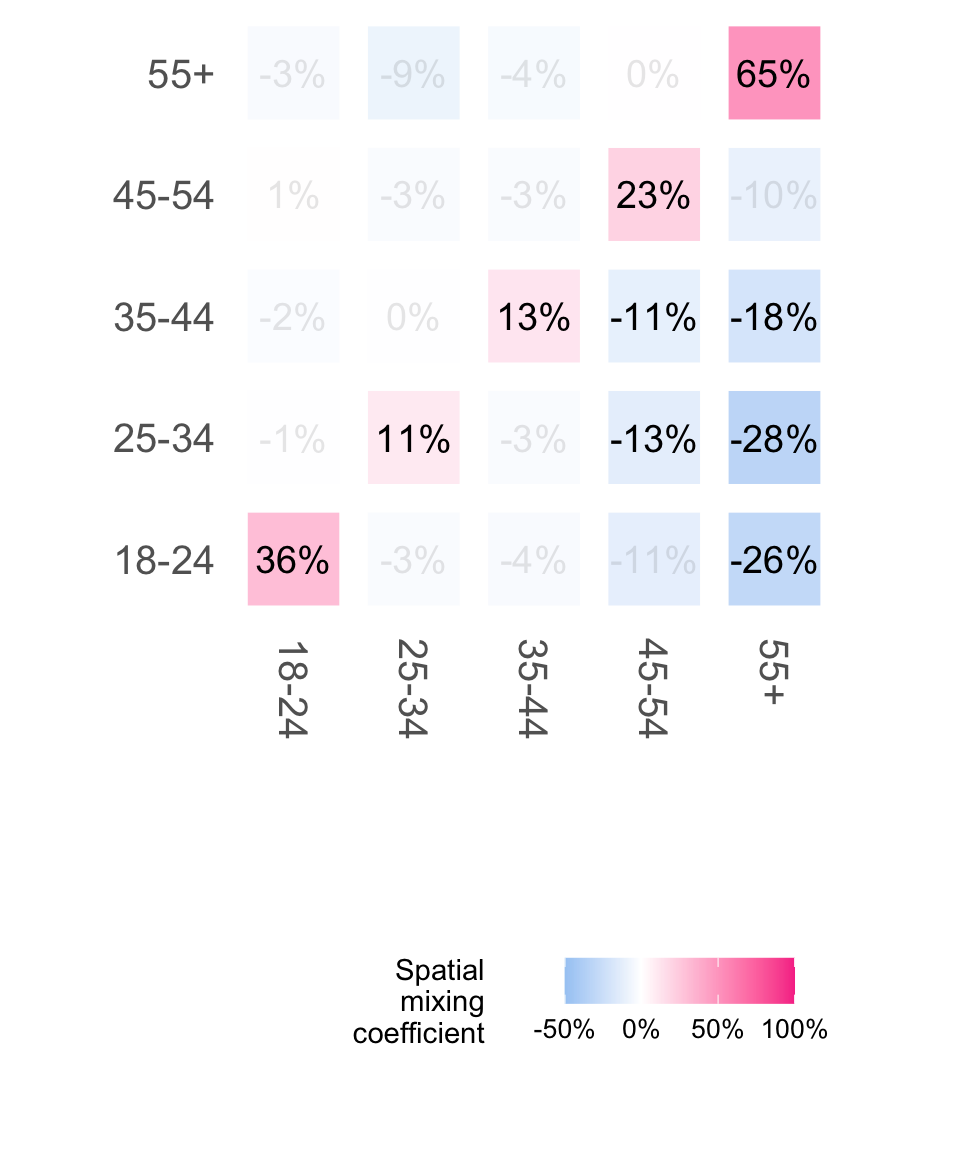
targets::tar_read(plotdata_sexorientation_mixing_matrix) |>
  dplyr::filter(ego_level != "Something Else", alter_level != "Something Else") |>
  plot_matrix_mixing() +
  scale_fill_mpxnyc_gradient("Spatial\nmixing\ncoefficient", labels = scales::label_percent(), breaks = c(-0.5, 0, 0.5, 1), limits = c(-0.5,  1.2)) +
  scale_color_mpxnyc_gradient() +
  ggplot2::scale_alpha_discrete(guide = "none") +
theme_mpxnyc_mixing() 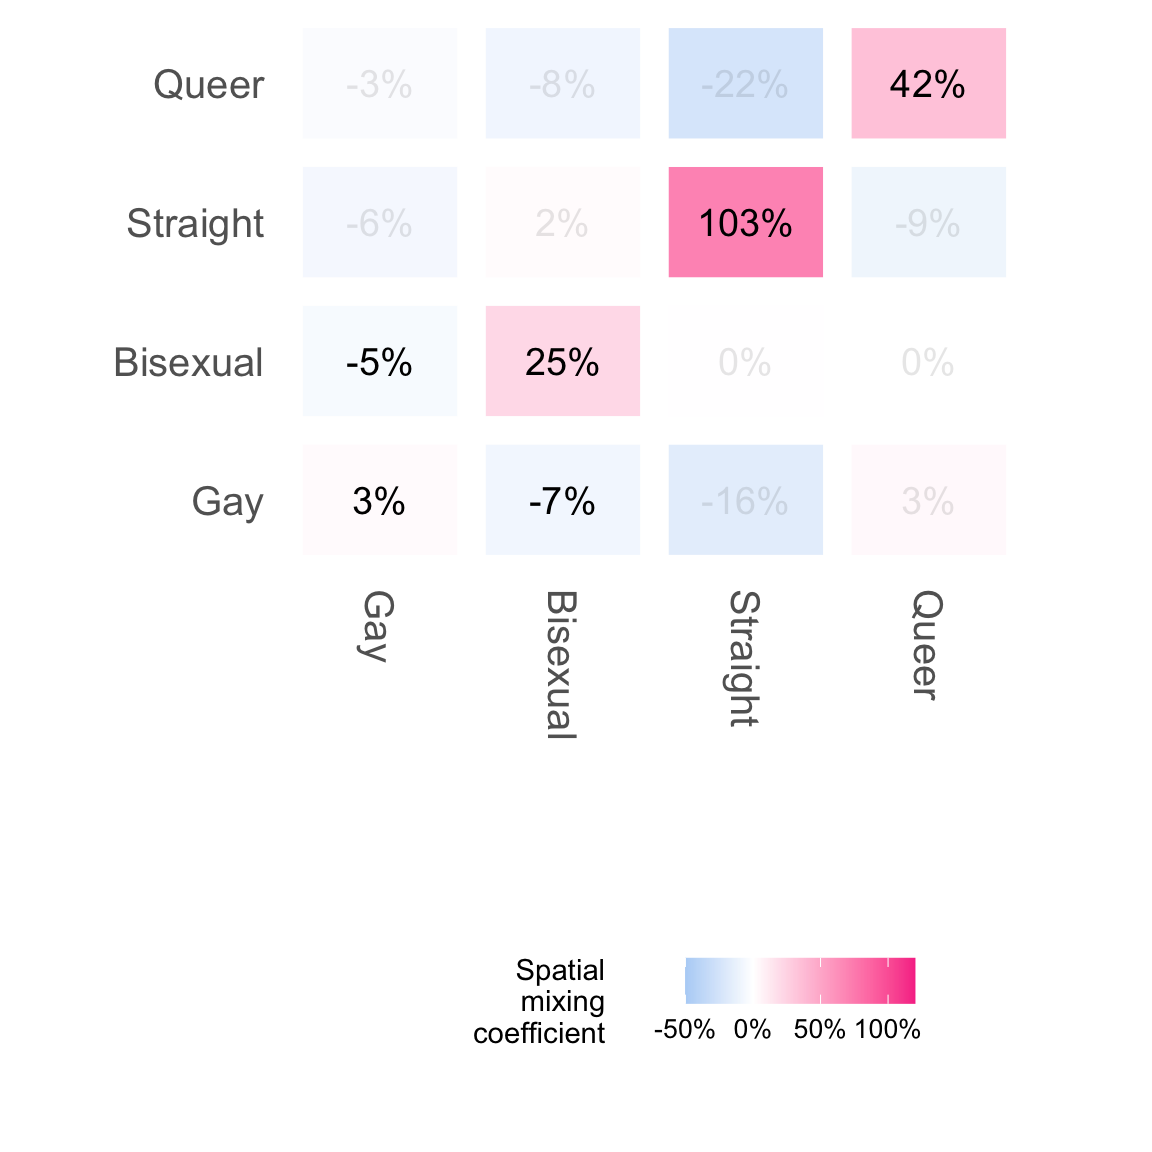
targets::tar_read(plotdata_racegender_mixing_matrix) |>
    dplyr::filter(ego_level != "Another demographic", alter_level != "Another demographic") |>
  plot_matrix_mixing() +
  scale_fill_mpxnyc_gradient("Spatial\nmixing\ncoefficient", labels = scales::label_percent(), breaks = c(-2, 0,  2), limits = c(-2, 2)) +
  scale_color_mpxnyc_gradient() +
  ggplot2::scale_alpha_discrete(guide = "none") +
  theme_mpxnyc_mixing()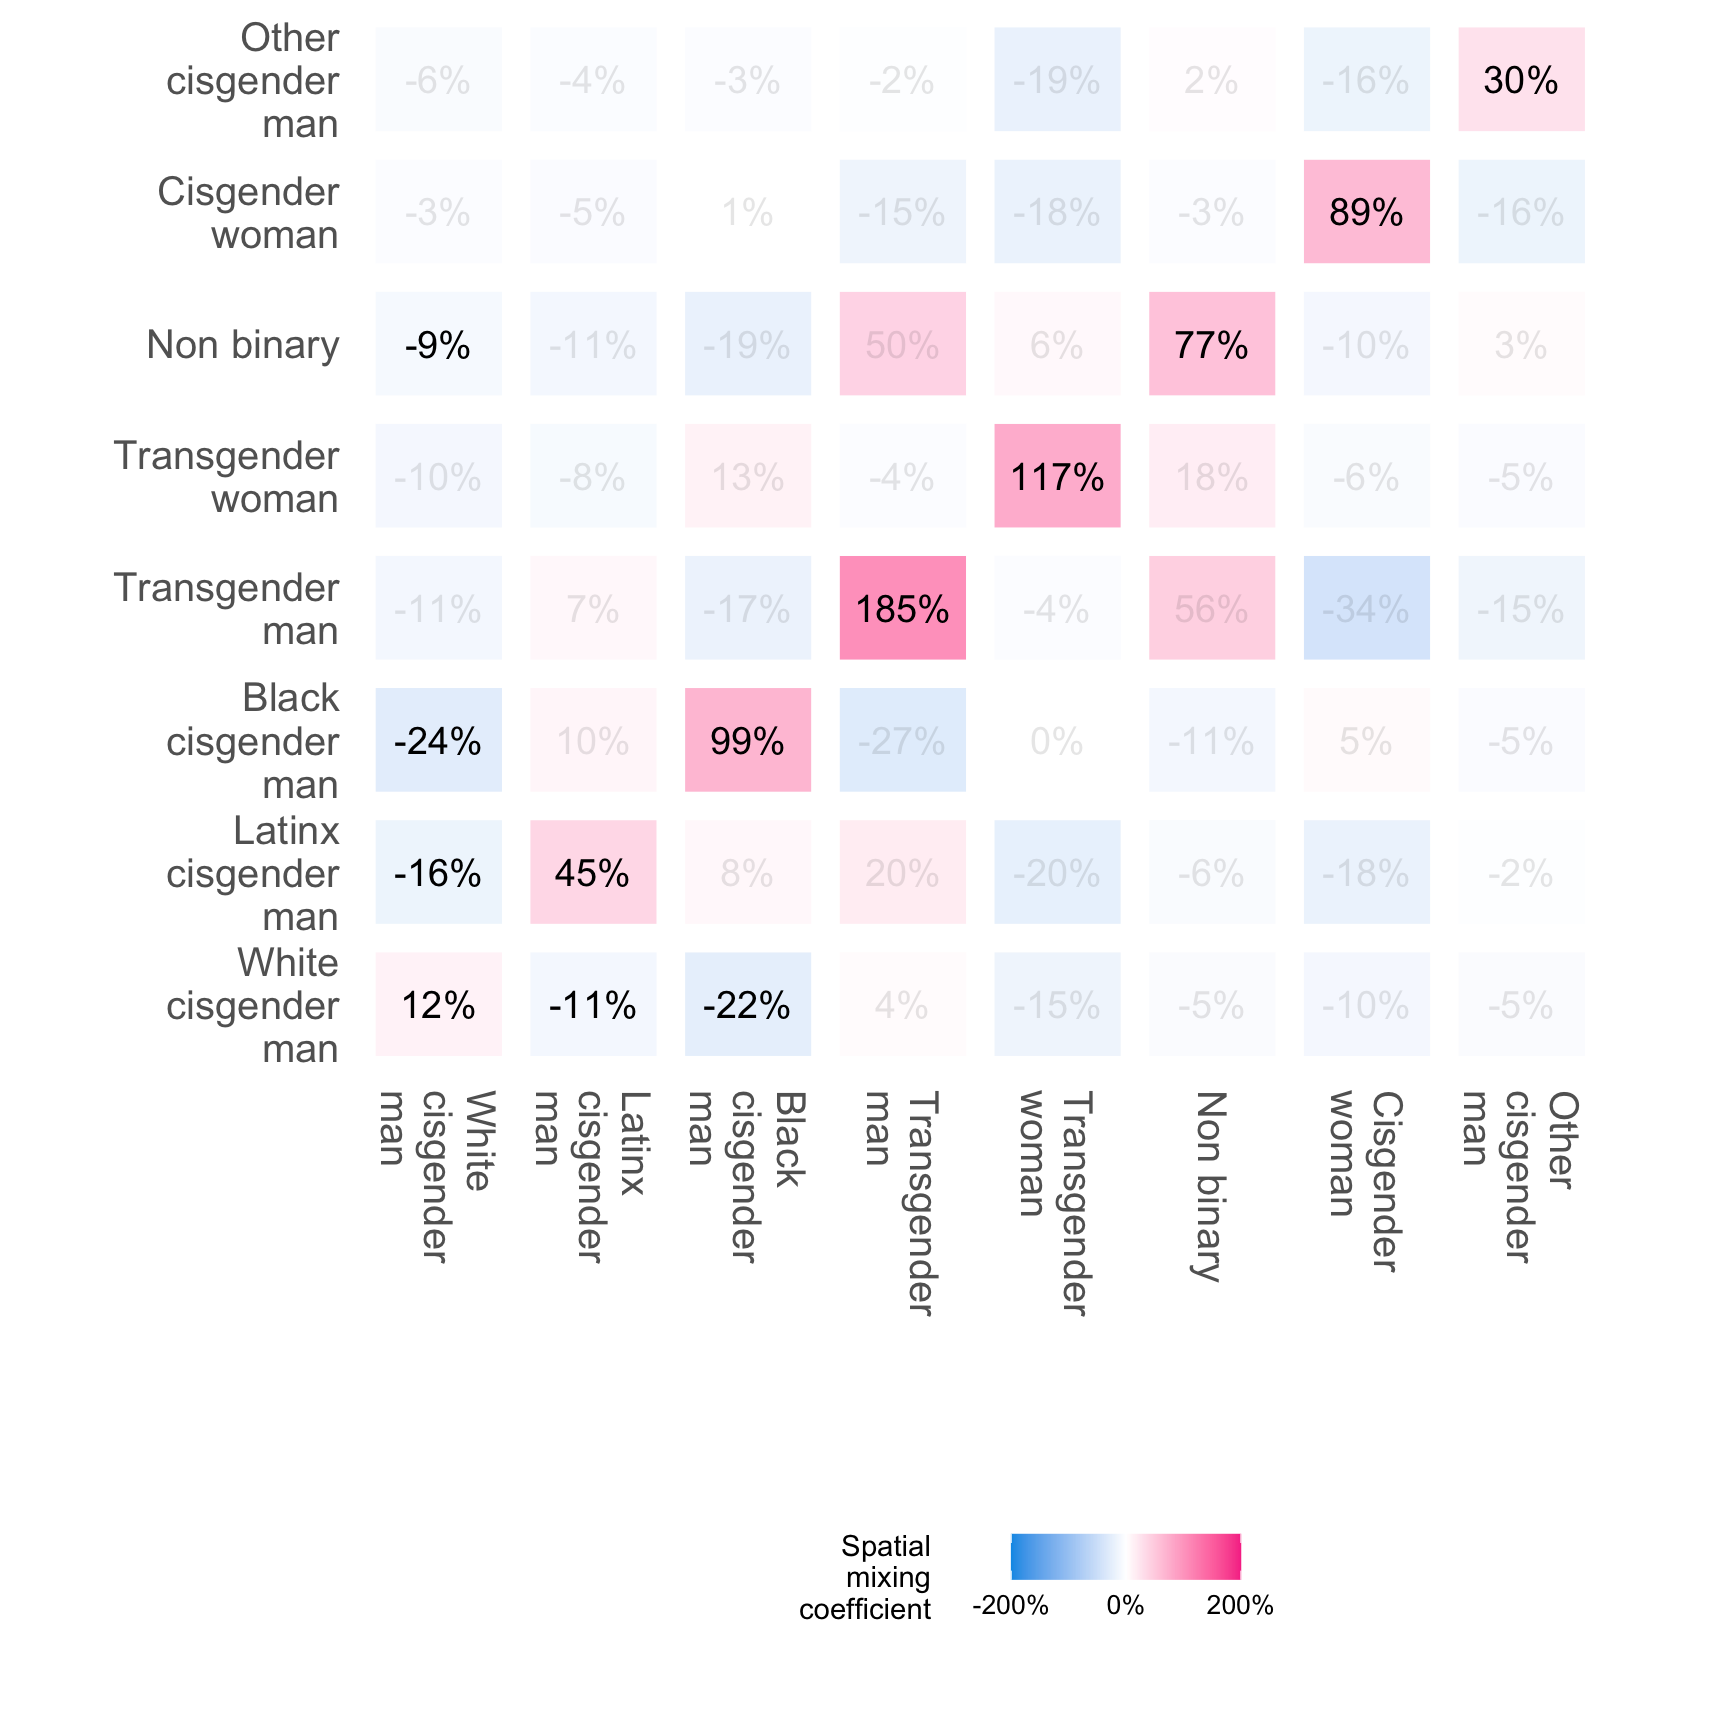
`