Code
# Access custom defined functions
targets::tar_source("../R_functions")# Access custom defined functions
targets::tar_source("../R_functions")make_plotdata_coverage_approach_choro() |>
plot_coverage_map() +
scale_fill_mpxnyc(name = "", na.translate = FALSE, option = "light") +
theme_mpxnyc_blank(legend.position = "bottom") 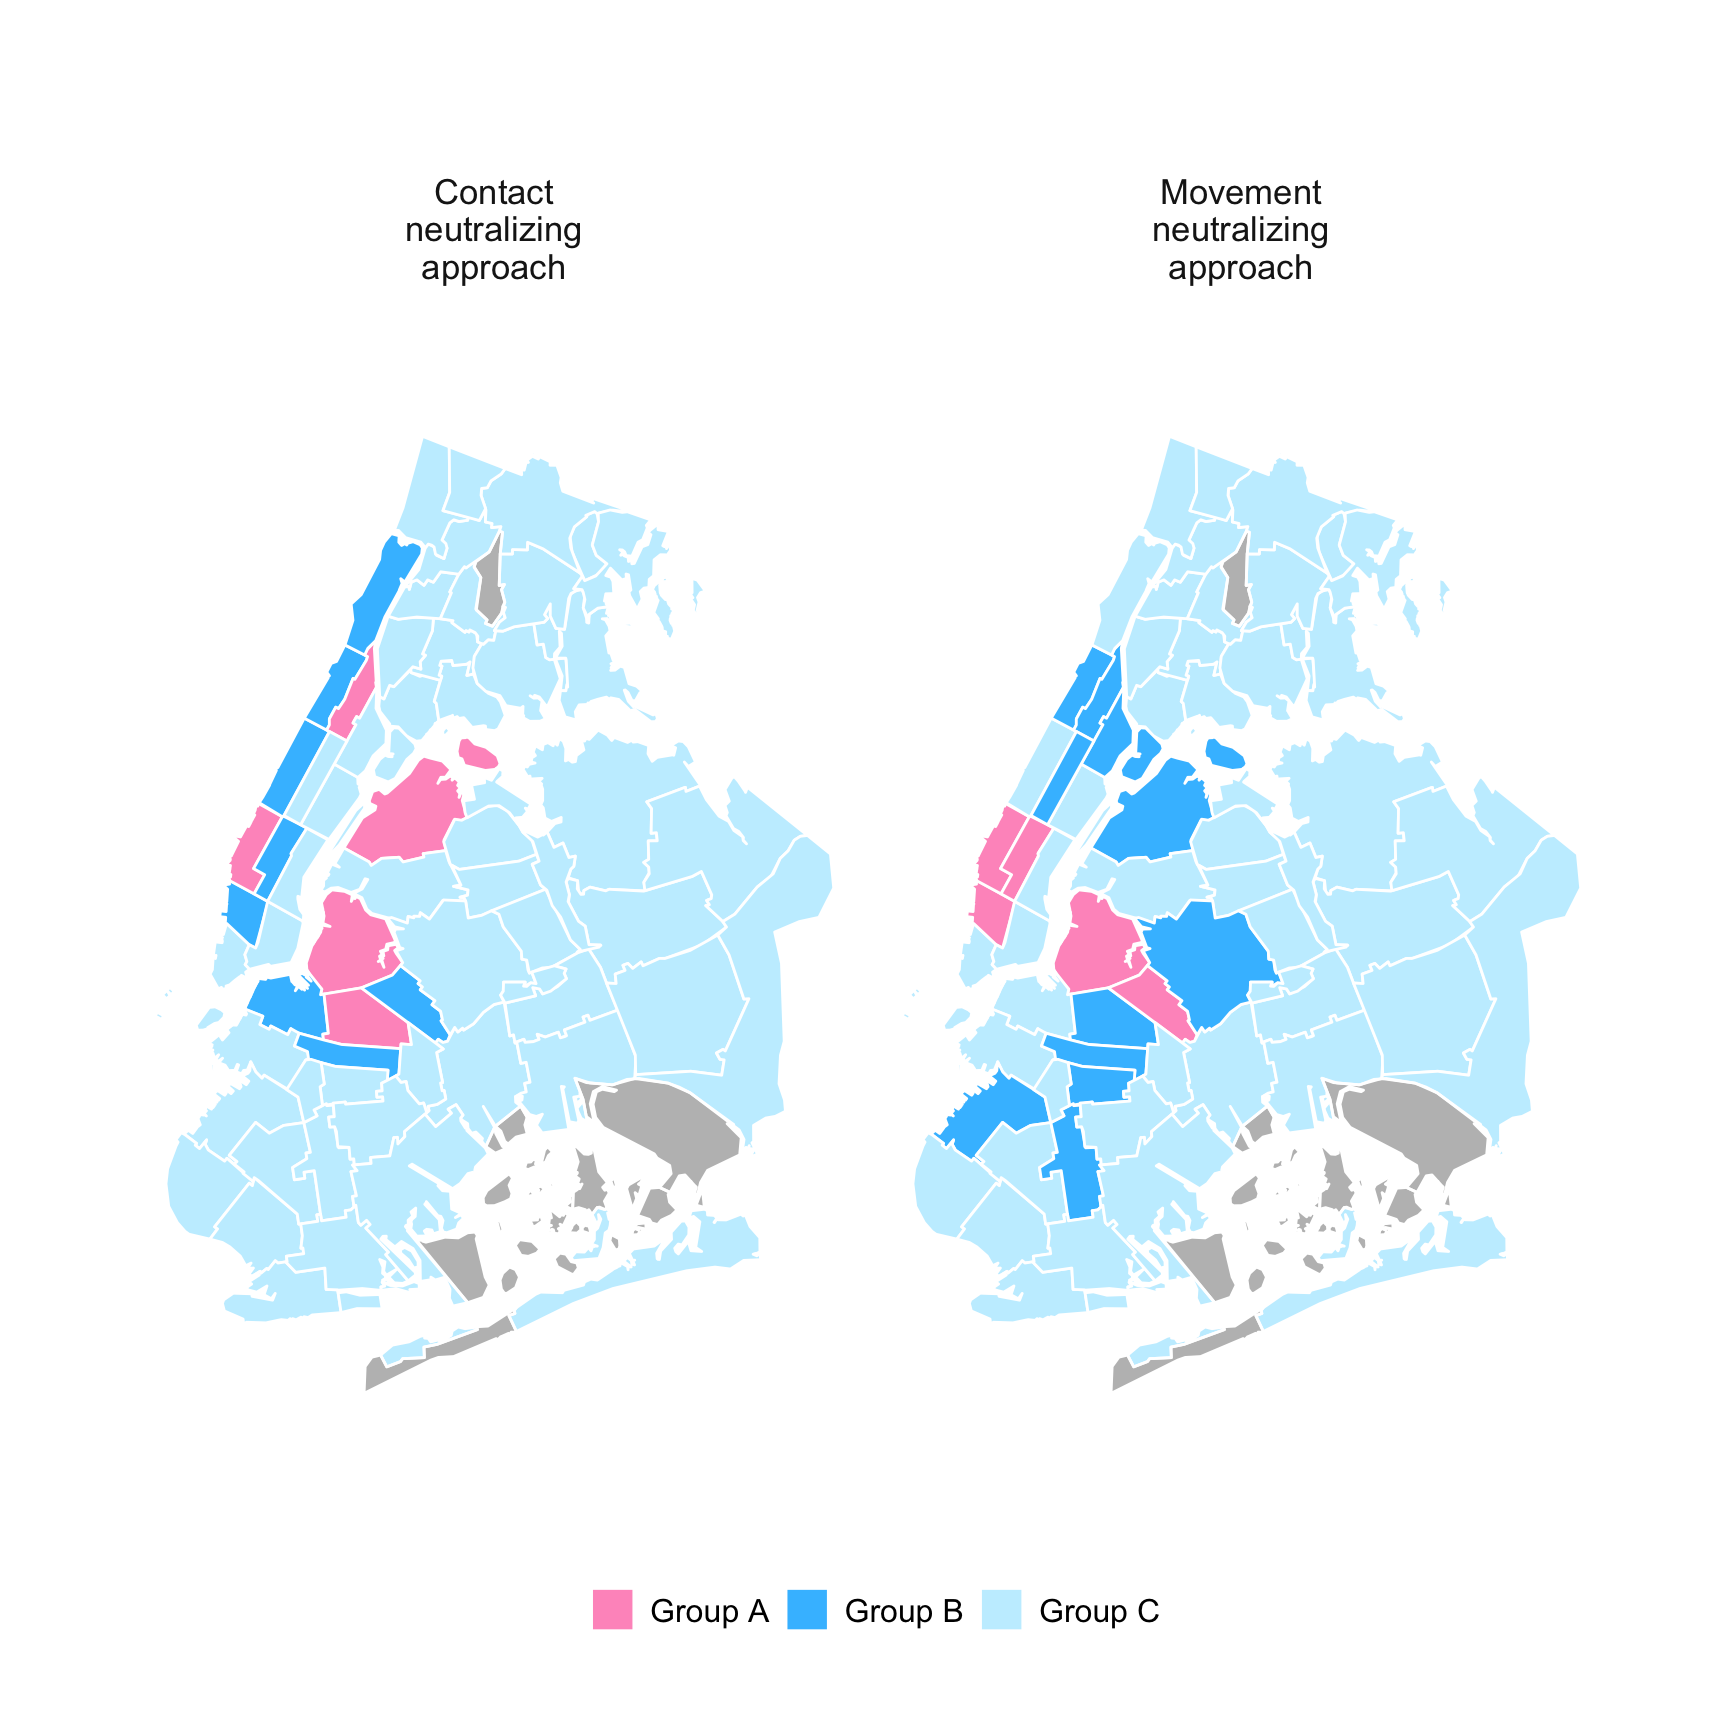
We modeled how different vaccination strategies that target the most influential community districts could disrupt transmission. Two strategies were compared: a contact-neutralizing strategy, which sees districts affiliated with the highest numbers of unvaccinated people as high priority, and a movement-neutralizing strategy, which priorities districts most connected by movement across neighborhoods.
Figure 10.2 and Figure 10.1 show which community districts would need to be immunized to reach one-third and two-thirds of the study population under each strategy. Under the contact-neutralizing strategy, just five community districts—Hell’s Kitchen–Chelsea (MN04), Williamsburg–Greenpoint (BK01), Central Harlem North (MN10), Bedford-Stuyvesant West (BK03), and Astoria (QN01)—would together cover roughly 33 percent of participants.
make_plotdata_coverage_approach_bar() |>
  plot_coverage_bar() +
  scale_fill_mpxnyc(name = "", na.translate = FALSE, option = "light")  +
  scale_axis_mpxnyc() +
  theme_mpxnyc_bar(legend.position = "bottom")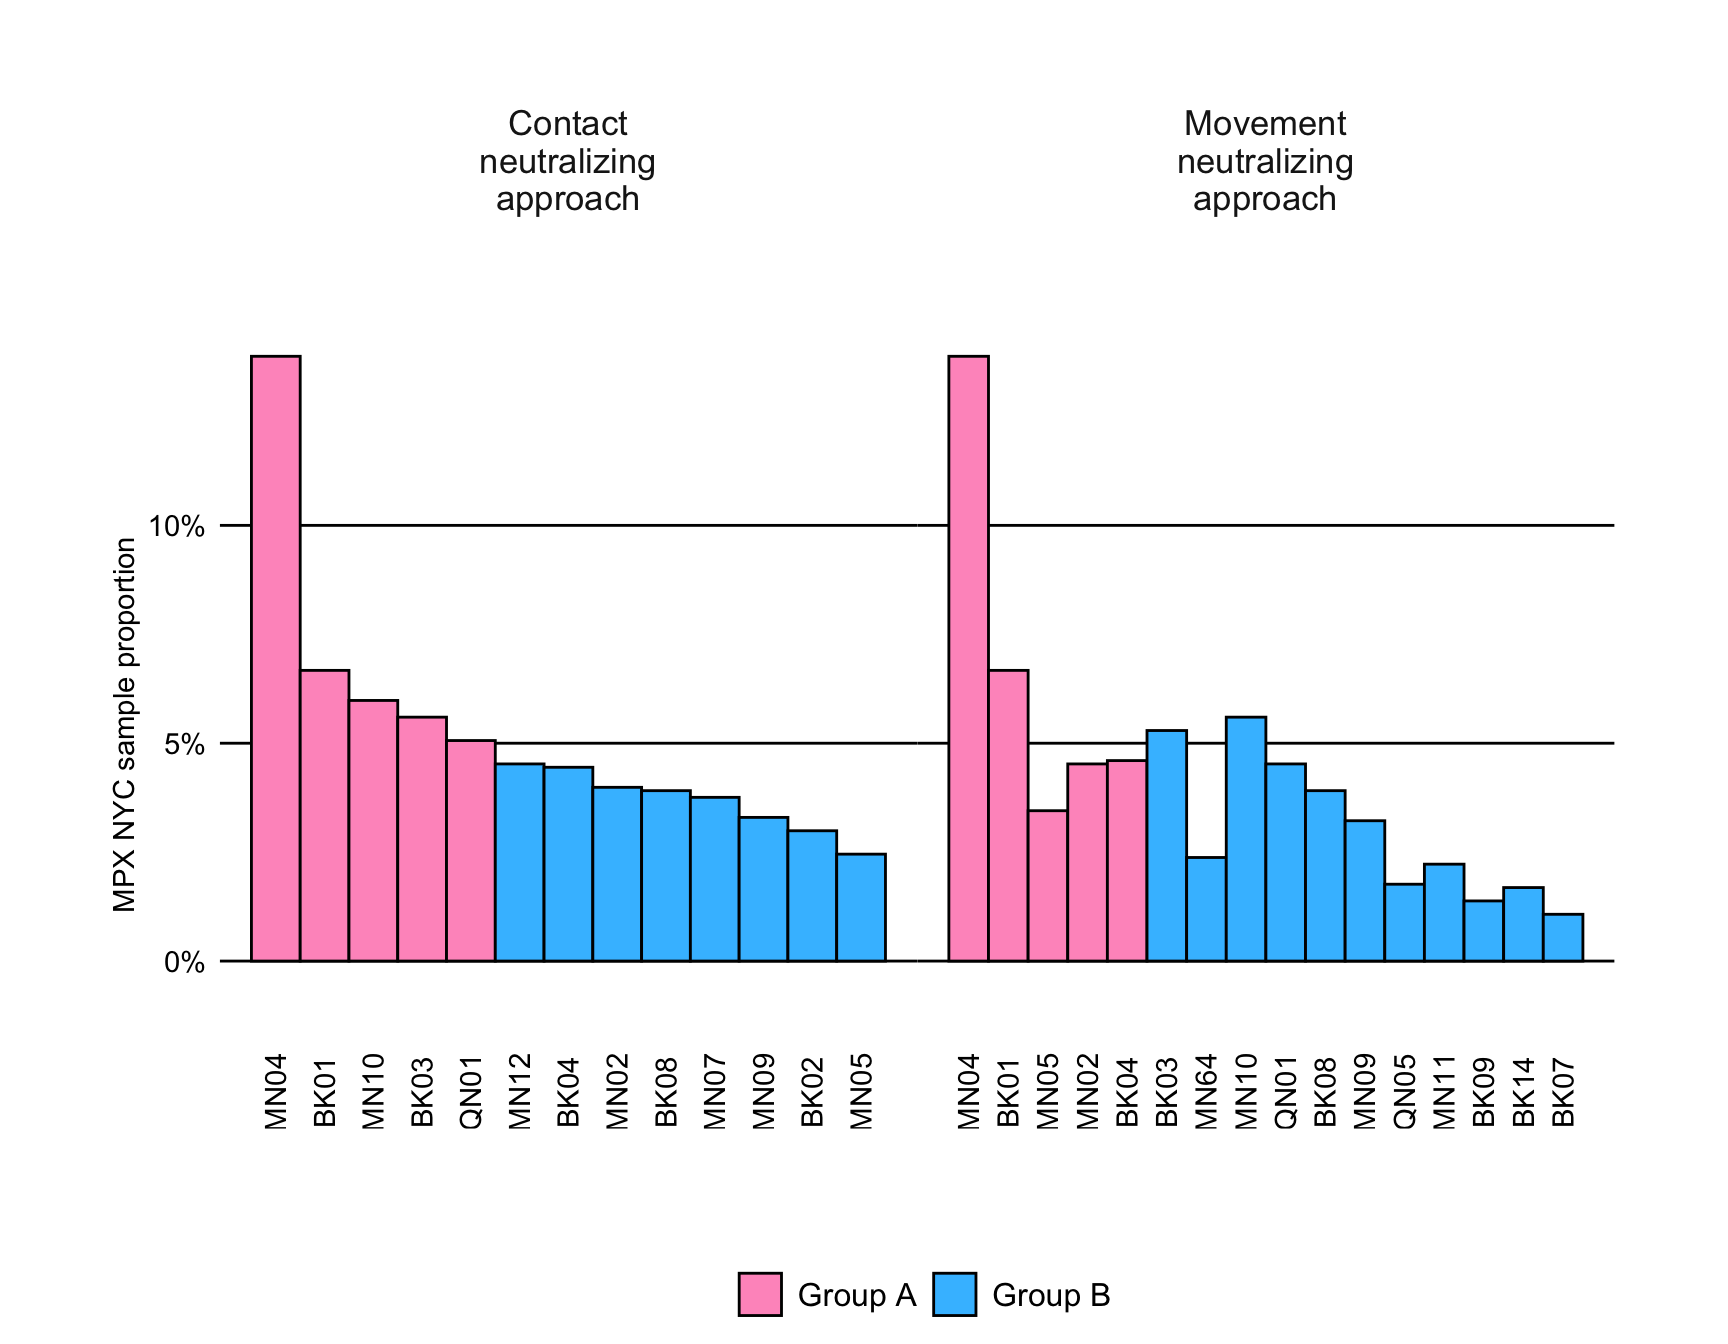
Expanding to 13 districts would reach 66 percent, adding Washington Heights South (MN12), Bushwick (BK04), West Village–SoHo–Tribeca (MN02), Crown Heights North (BK08), Upper West Side Central (MN07), Hamilton Heights–Sugar Hill (MN09), Brooklyn Heights–Downtown (BK02), and Midtown–Times Square–Flatiron (MN05).
Under the movement-neutralizing strategy, six districts would be needed to reach 33 percent—Hell’s Kitchen–Chelsea (MN04), Williamsburg–Greenpoint (BK01), Midtown–Times Square–Flatiron (MN05), Bushwick (BK04), West Village–SoHo–Tribeca (MN02), and Bedford-Stuyvesant West (BK03).
To reach 66 percent, 16 districts would need to be included, adding Central Park–Upper East Side (MN64), Central Harlem North (MN10), Astoria (QN01), Crown Heights North (BK08), Hamilton Heights–Sugar Hill (MN09), Ridgewood–Maspeth (QN05), Crown Heights South (BK09), East Harlem (MN11), Flatbush–Ditmas Park (BK14), and Sunset Park (BK07).
Figure 10.3 shows how these strategies affect network connectivity. Before any intervention, nearly every participant belonged to a single large connected component, meaning potential transmission paths linked most of the population. As immunization expanded, this component fragmented—more sharply under the movement-neutralizing approach than under the contact-based one.
make_plotdata_net_impact_profile() |>
  plot_centrality_bar() +
  scale_fill_mpxnyc(name = "", option = "light") +
  scale_axis_mpxnyc() +
  scale_x_continuous_mpxnyc() +
theme_mpxnyc_netimpact() 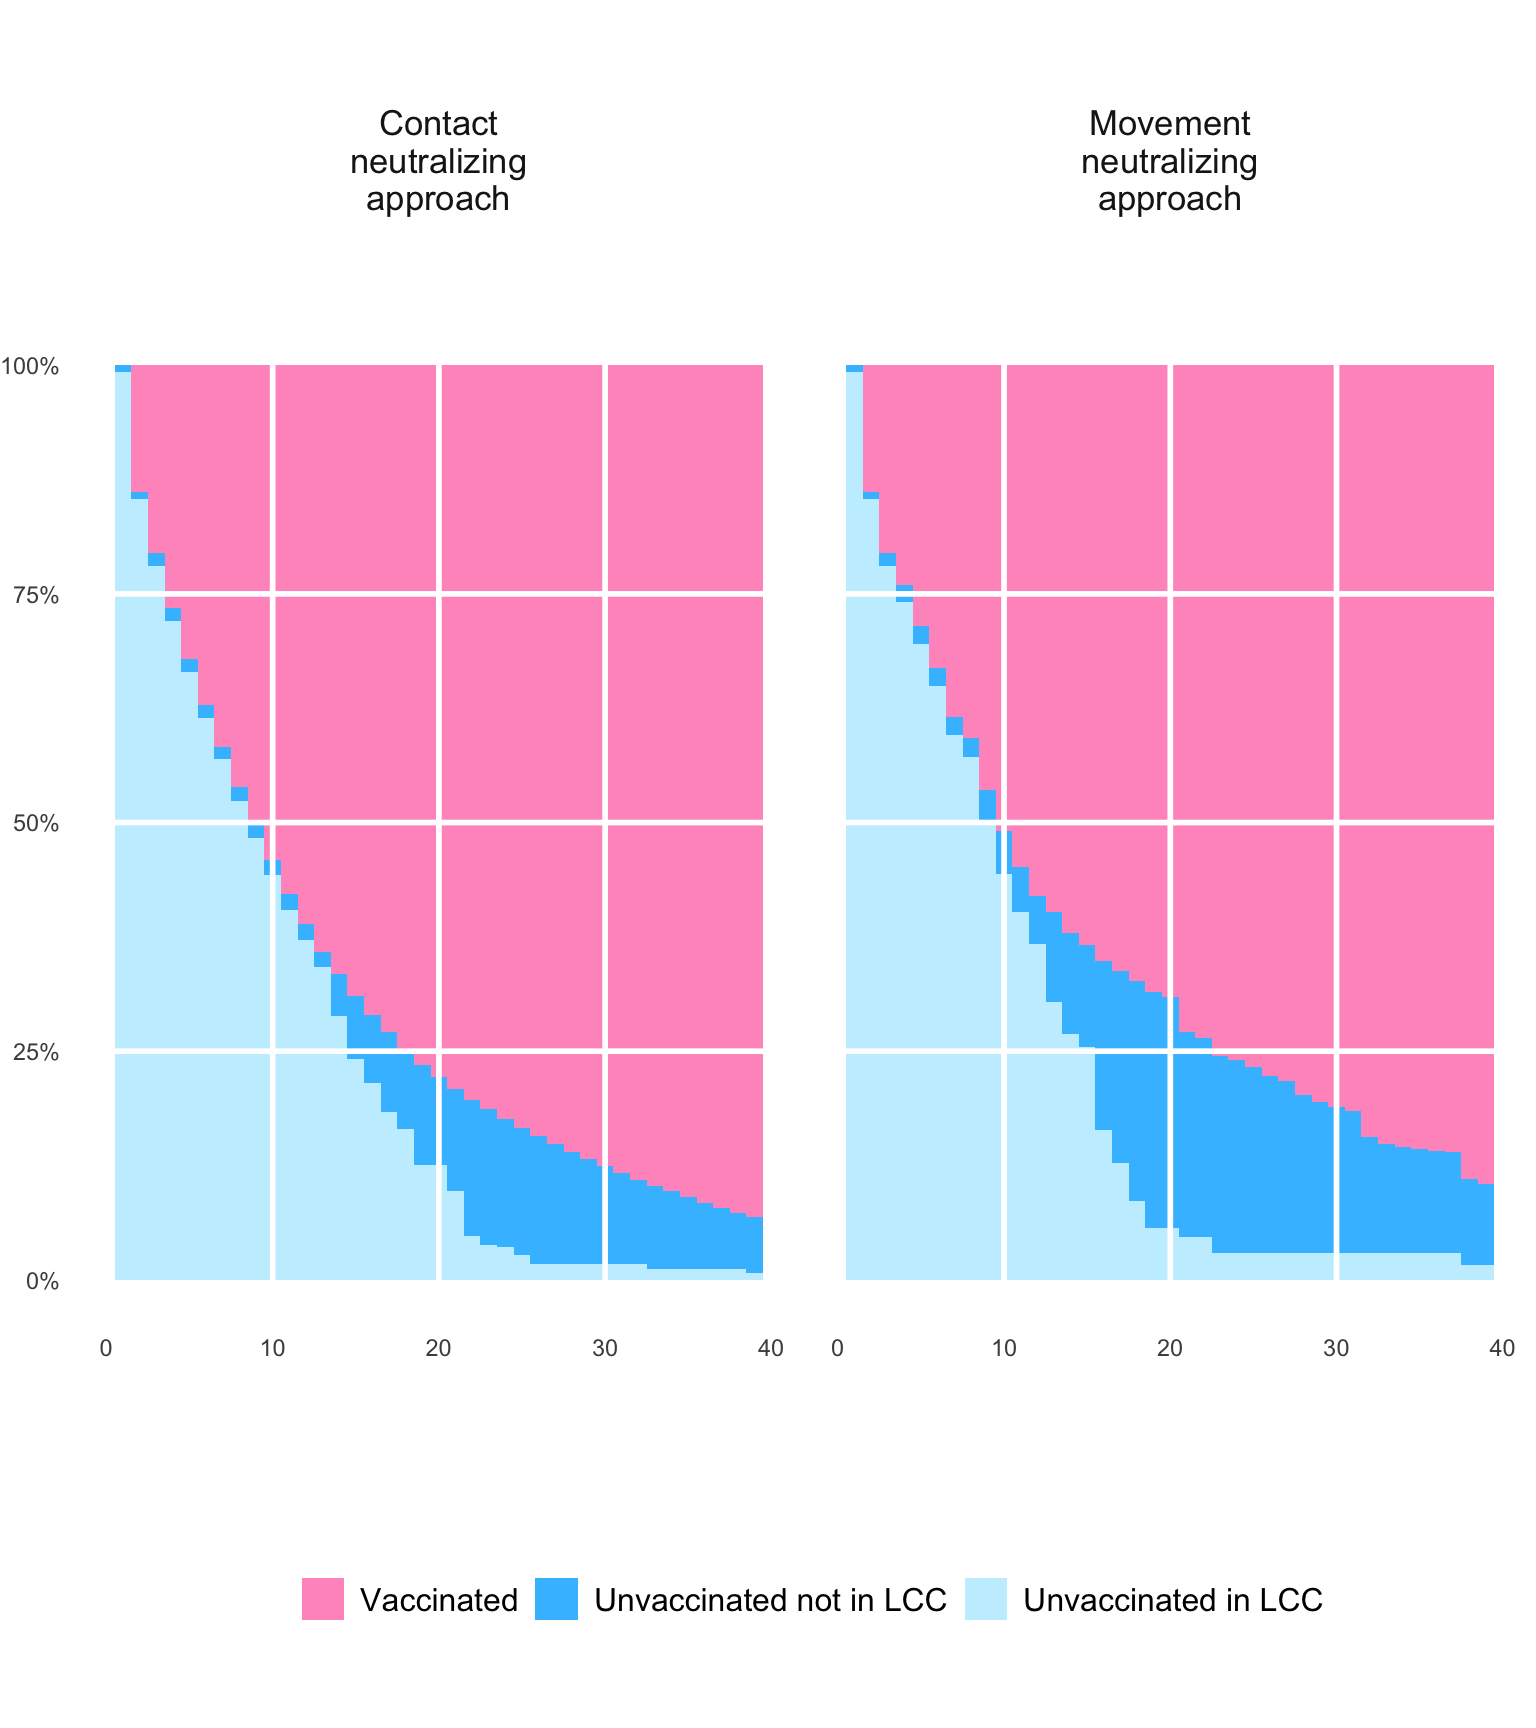
The movement-neutralizing strategy reduced overall network connectivity faster, suggesting it may better interrupt chains of exposure by severing travel-based bridges between boroughs. In contrast, the contact-neutralizing approach more efficiently reduced the proportion of unvaccinated individuals, directly shrinking susceptible clusters. Differences between the two approaches became pronounced only after roughly ten districts were vaccinated, highlighting how epidemic control depends on both social density and mobility.
Together, these models illustrate that how a city moves matters as much as where people meet. In an interconnected urban network like New York, interventions focused solely on individual contact density may miss the spatial bridges that sustain outbreaks. By contrast, targeting districts that anchor both nightlife and movement—such as Hell’s Kitchen (MN04), Williamsburg (BK01), and Bushwick (BK04)—could achieve the dual goal of slowing transmission and preserving community life with fewer resources.
plot_icon(icon_name = "unicorn", color = "light_pink", shape = 8)