G - MPX NYC: Results

G.1 People

Race and gender

Code
make_table_freq1(demo_group) |>  
  plot_bar() +
  theme_mpxnyc_bar() +
  scale_axis_mpxnyc() +
  scale_fill_mpxnyc(name = "Race / gender") 

Code
make_table_freq1(demo_group) |>
  draw_table_1("Race-Gender")
Race-Gender
(MPX NYC, 2022)
N % (CI)
Another demographic 26 2% (1-3)
Black cisgender man 131 10% (8-12)
Cisgender woman 62 5% (4-6)
Latinx cisgender man 198 15% (13-17)
Non binary 96 7% (6-9)
Other cisgender man 176 13% (12-15)
Transgender man 34 3% (2-3)
Transgender woman 29 2% (1-3)
White cisgender man 552 42% (40-45)

Age

Code
  make_table_freq1(age) |>
    plot_bar() +
    theme_mpxnyc_bar() +
    scale_axis_mpxnyc() +
    scale_fill_mpxnyc(name = "Age group")

Code
make_table_freq1(age) |>
  draw_table_1("Age")
Age
(MPX NYC, 2022)
N % (CI)
18-24 195 15% (13-17)
25-34 538 41% (39-44)
35-44 325 25% (23-27)
45-54 145 11% (9-13)
55+ 101 8% (6-9)

Recruitment Channel

Code
make_table_freq1(channel) |>
  plot_bar()  +
  theme_mpxnyc_bar() +
  scale_axis_mpxnyc() +
  scale_fill_mpxnyc(name = "Recruitment\nchannel")

Code
make_table_freq1(channel) |>
  draw_table_1("Channel")
Channel
(MPX NYC, 2022)
N % (CI)
Grindr 706 54% (51-57)
Instagram 112 9% (7-10)
Partner toolkit 142 11% (9-13)
Twitter 62 5% (4-6)
Unknown 282 22% (19-24)

Gender identity

Code
make_table_freq1(genderId) |>  
  plot_bar() +
  theme_mpxnyc_bar() +
  scale_axis_mpxnyc("MPX NYC sample proportion") +
  scale_fill_mpxnyc(name = "Gender\nmodality")

Code
make_table_freq1(genderId) |>
  draw_table_1("Gender")
Gender
(MPX NYC, 2022)
N % (CI)
Another Demographic 26 2% (1-3)
Cisgender Man 1057 81% (79-83)
Cisgender Woman 62 5% (4-6)
Non Binary 96 7% (6-9)
Transgender Man 34 3% (2-3)
Transgender Woman 29 2% (1-3)

Sexual Orientation

Code
make_table_freq1(sexOrientation) |>    
  plot_bar() +
  theme_mpxnyc_bar() +
  scale_axis_mpxnyc() +
  scale_fill_mpxnyc(name = "Sexual\norientation")

Code
make_table_freq1(sexOrientation) |>
  draw_table_1("Sexual Orientation")
Sexual Orientation
(MPX NYC, 2022)
N % (CI)
Bisexual 186 14% (12-16)
Gay 860 66% (63-68)
Queer 159 12% (10-14)
Something Else 35 3% (2-4)
Straight 64 5% (4-6)

Sexual or physical contact with more than two other people at the same time

Code
make_table_freq1(groupSex) |>  
  plot_bar()  +
  theme_mpxnyc_bar() +
  scale_axis_mpxnyc() +
  scale_fill_mpxnyc(name = "Group contact")

Code
make_table_freq1(groupSex) |> 
  draw_table_1("Group Sex / Contact past 4 weeks") 
Group Sex / Contact past 4 weeks
(MPX NYC, 2022)
N % (CI)
No 774 59% (57-62)
Yes 530 41% (38-43)

Race

Code
make_table_freq1(race) |>
  plot_bar()  +
  theme_mpxnyc_bar() +
  scale_axis_mpxnyc() +
  scale_fill_mpxnyc(name = "Race")

Code
make_table_freq1(race) |>
  draw_table_1("Race")
Race
(MPX NYC, 2022)
N % (CI)
Another Group 57 4% (3-5)
Asian 84 6% (5-8)
Black 156 12% (10-14)
Latinx 231 18% (16-20)
Multi Racial 79 6% (5-7)
White 695 53% (51-56)

Sexual orientation by race and gender

Code
make_table_freq2(sexOrientation, demo_group) |>
  plot_radar_grid()   +
  scale_radial_mpxnyc() +
  scale_fill_mpxnyc(name = "") +
  theme_mpxnyc_radar_people() 

Code
make_table_freq2(sexOrientation, demo_group)  |>
  draw_table_2("Sexual Orientation by Race-Gender") 
Sexual Orientation by Race-Gender
(MPX NYC, 2022)
N % (CI)
Another demographic
Bisexual 3 12% (3-26)
Gay 5 19% (5-35)
Queer 11 42% (24-62)
Something Else 6 23% (7-39)
Straight 1 4% (3-15)
Black cisgender man
Bisexual 24 18% (12-25)
Gay 88 67% (59-76)
Queer 9 7% (3-11)
Something Else 4 3% (1-6)
Straight 6 5% (1-9)
Cisgender woman
Bisexual 19 31% (20-42)
Gay 4 6% (2-13)
Queer 16 26% (15-37)
Straight 23 37% (25-49)
Latinx cisgender man
Bisexual 24 12% (8-17)
Gay 158 80% (74-86)
Queer 9 5% (2-8)
Something Else 2 1% (0-3)
Straight 5 3% (1-5)
Non binary
Bisexual 18 19% (12-26)
Gay 24 25% (17-34)
Queer 53 55% (45-65)
Something Else 1 1% (1-4)
Other cisgender man
Bisexual 24 14% (9-19)
Gay 136 77% (71-83)
Queer 10 6% (2-9)
Straight 6 3% (1-6)
Transgender man
Bisexual 10 29% (13-46)
Gay 7 21% (9-35)
Queer 14 41% (24-59)
Something Else 1 3% (2-11)
Straight 2 6% (2-15)
Transgender woman
Bisexual 7 24% (11-39)
Gay 3 10% (3-24)
Queer 4 14% (4-29)
Something Else 6 21% (7-37)
Straight 9 31% (15-50)
White cisgender man
Bisexual 57 10% (8-13)
Gay 435 79% (75-82)
Queer 33 6% (4-8)
Something Else 15 3% (1-4)
Straight 12 2% (1-3)

HIV and PrEP status by race and gender

Code
make_table_freq2(hivPrep, demo_group) |>
  plot_radar_grid()  +
  scale_radial_mpxnyc() +
  scale_fill_mpxnyc(name = "") +
  theme_mpxnyc_radar_people() 

Code
make_table_freq2(hivPrep, demo_group) |>
  draw_table_2("HIV and PrEP Status by Race-Gender") 
HIV and PrEP Status by Race-Gender
(MPX NYC, 2022)
N % (CI)
Another demographic
No 11 48% (23-61)
Yes 12 52% (26-65)
Black cisgender man
No 56 62% (34-51)
Yes 34 38% (19-33)
Cisgender woman
No 61 100% (94-100)
Latinx cisgender man
No 95 56% (41-55)
Yes 74 44% (31-44)
Non binary
No 62 68% (55-73)
Yes 29 32% (22-40)
Other cisgender man
No 92 56% (45-60)
Yes 73 44% (34-49)
Transgender man
No 23 68% (50-82)
Yes 11 32% (18-50)
Transgender woman
No 16 64% (37-72)
Yes 9 36% (14-49)
White cisgender man
No 242 48% (39-48)
Yes 263 52% (44-52)

MPOX vaccination status by race and gender

Code
make_table_freq2(monkeypoxVaccine, demo_group) |>
  plot_radar_grid()  +
  scale_radial_mpxnyc() +
  scale_fill_mpxnyc(name = "") +
  theme_mpxnyc_radar_people() 

Code
make_table_freq2(monkeypoxVaccine, demo_group) |>
  draw_table_2( "Mpox Vax Status by Race-Gender") 
Mpox Vax Status by Race-Gender
(MPX NYC, 2022)
N % (CI)
Another demographic
No 8 31% (14-48)
Unsure 1 4% (3-15)
Yes 17 65% (48-83)
Black cisgender man
No 50 38% (29-46)
Yes 81 62% (54-71)
Cisgender woman
No 51 82% (73-91)
Unsure 1 2% (1-6)
Yes 10 16% (7-25)
Latinx cisgender man
No 77 39% (32-46)
Yes 121 61% (54-68)
Non binary
No 32 33% (24-43)
Unsure 1 1% (1-4)
Yes 63 66% (56-75)
Other cisgender man
No 51 29% (22-36)
Unsure 2 1% (1-3)
Yes 123 70% (63-77)
Transgender man
No 10 29% (15-46)
Yes 24 71% (54-85)
Transgender woman
No 17 59% (41-77)
Unsure 1 3% (3-12)
Yes 11 38% (20-56)
White cisgender man
No 131 24% (20-27)
Unsure 1 0% (0-1)
Yes 420 76% (73-80)

G.2 Places

Type of venue for contact vs. type of contact

Code
make_table_freq2(placeType, placeSex, person_analysis = FALSE) |>
  plot_radar_stratified() +
  scale_radial_mpxnyc() +
  scale_fill_mpxnyc(name = "") +
  theme_mpxnyc_radar_places() 

Code
make_table_freq2(placeType, placeSex, person_analysis = FALSE) |>
  draw_table_2("Venue type vs. sexual contact")
Venue type vs. sexual contact
(MPX NYC, 2022)
N % (CI)
Did not have sex
Concert/Theatre/Show 63 24% (18-29)
Dance Party 110 42% (35-48)
Dark Room/Sex Party 10 4% (2-6)
Private Residence 28 11% (7-14)
Something Else 40 15% (11-20)
Sport Game 13 5% (2-8)
Had sex
Concert/Theatre/Show 4 1% (0-2)
Dance Party 33 9% (6-13)
Dark Room/Sex Party 52 15% (11-19)
Private Residence 222 63% (57-68)
Something Else 40 11% (8-15)
Sport Game 1 0% (0-1)

Type of venue for contact vs. distance from home

Code
make_table_freq2(placeType, distanceFromHome, person_analysis = FALSE) |>
  plot_radar_stratified() +
  scale_fill_mpxnyc(name = "") +
  scale_radial_mpxnyc() +
  theme_mpxnyc_radar_places() 

Code
make_table_freq2(placeType, distanceFromHome, person_analysis = FALSE) |>
  draw_table_2("Venue type vs. distance from home")
Venue type vs. distance from home
(MPX NYC, 2022)
N % (CI)
Different Borough
Concert/Theatre/Show 26 13% (8-18)
Dance Party 64 32% (25-38)
Dark Room/Sex Party 29 14% (10-20)
Private Residence 47 23% (17-31)
Something Else 25 12% (7-18)
Sport Game 9 4% (2-7)
Same Borough
Concert/Theatre/Show 36 16% (11-21)
Dance Party 56 24% (19-30)
Dark Room/Sex Party 22 10% (6-13)
Private Residence 73 32% (25-38)
Something Else 39 17% (12-22)
Sport Game 4 2% (0-4)
Same Community District
Concert/Theatre/Show 5 3% (1-5)
Dance Party 23 12% (8-18)
Dark Room/Sex Party 11 6% (3-10)
Private Residence 130 70% (63-77)
Something Else 16 9% (5-13)
Sport Game 1 1% (0-2)

Place type vs. Distance from home vs. Sex contact

Code
make_table_freq3( placeType, distanceFromHome, placeSex, person_analysis = FALSE) |>
  plot_radar_stratified2()  +
  scale_fill_mpxnyc(name = "") +
  scale_radial_mpxnyc() +
  theme_mpxnyc_radar_places() 

Code
make_table_freq3( placeType, distanceFromHome, placeSex, person_analysis = FALSE)  |>
  draw_table_3("Venue type by home distance and sexual contact")
Venue type by home distance and sexual contact
(MPX NYC, 2022)
N % (CI)
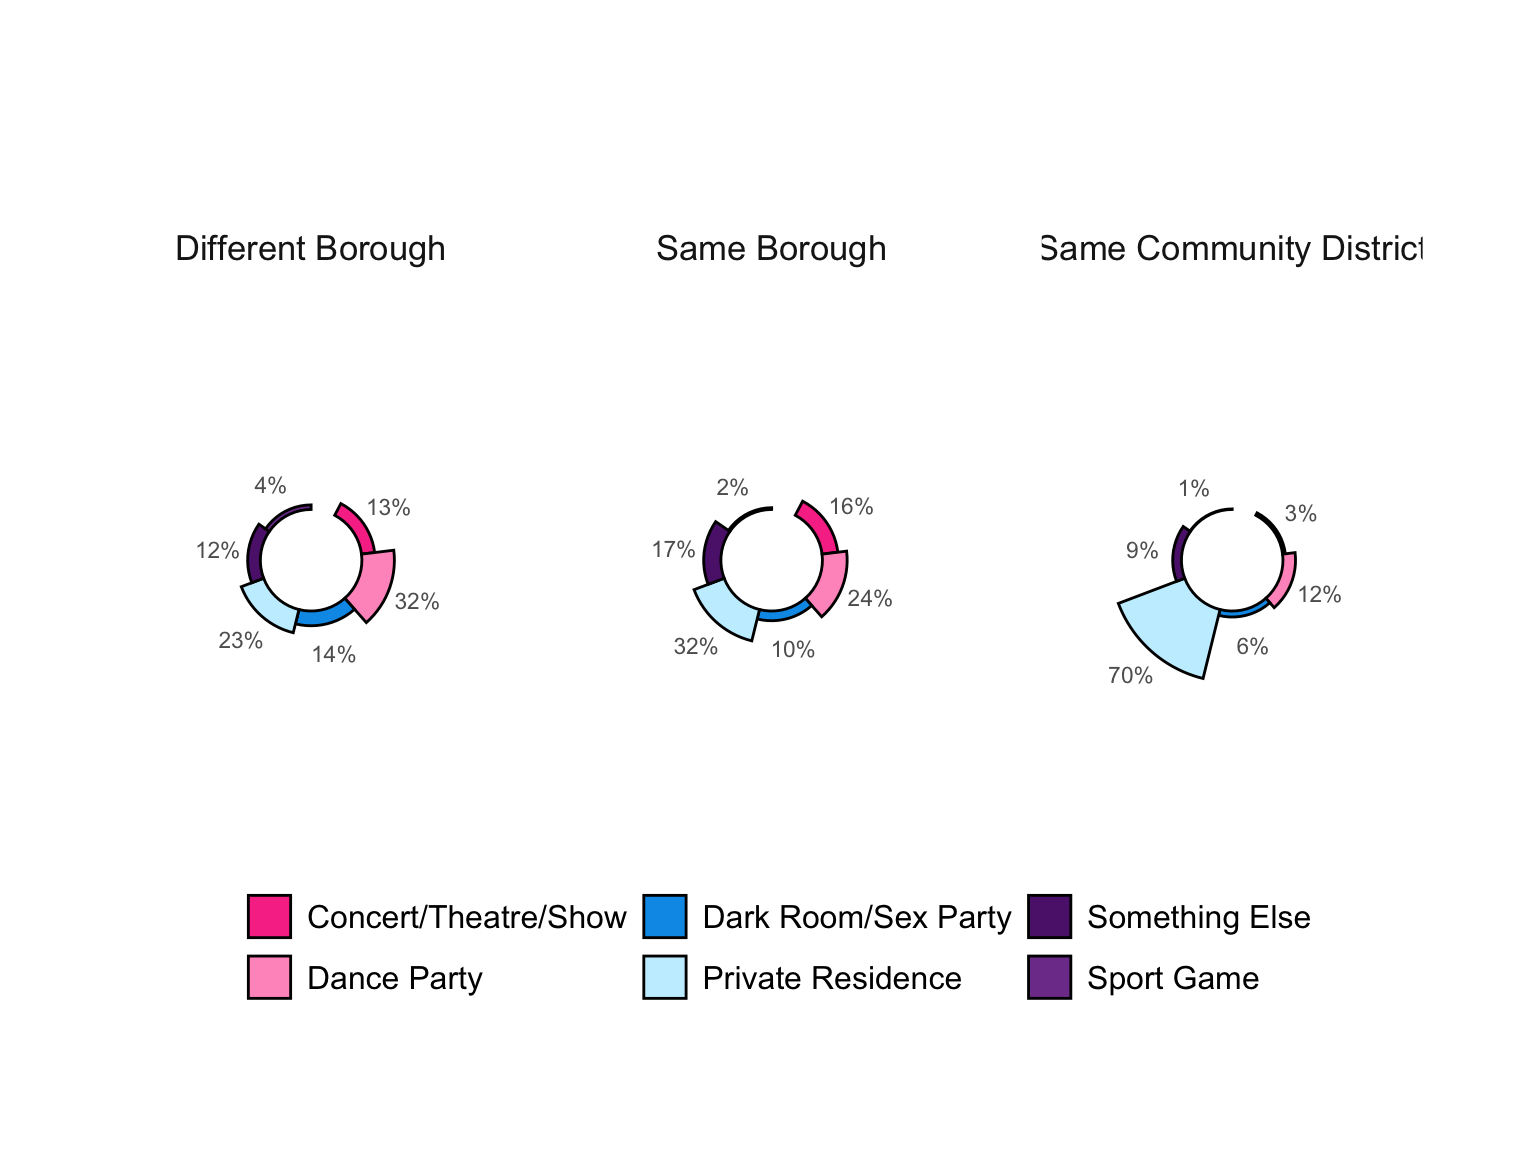
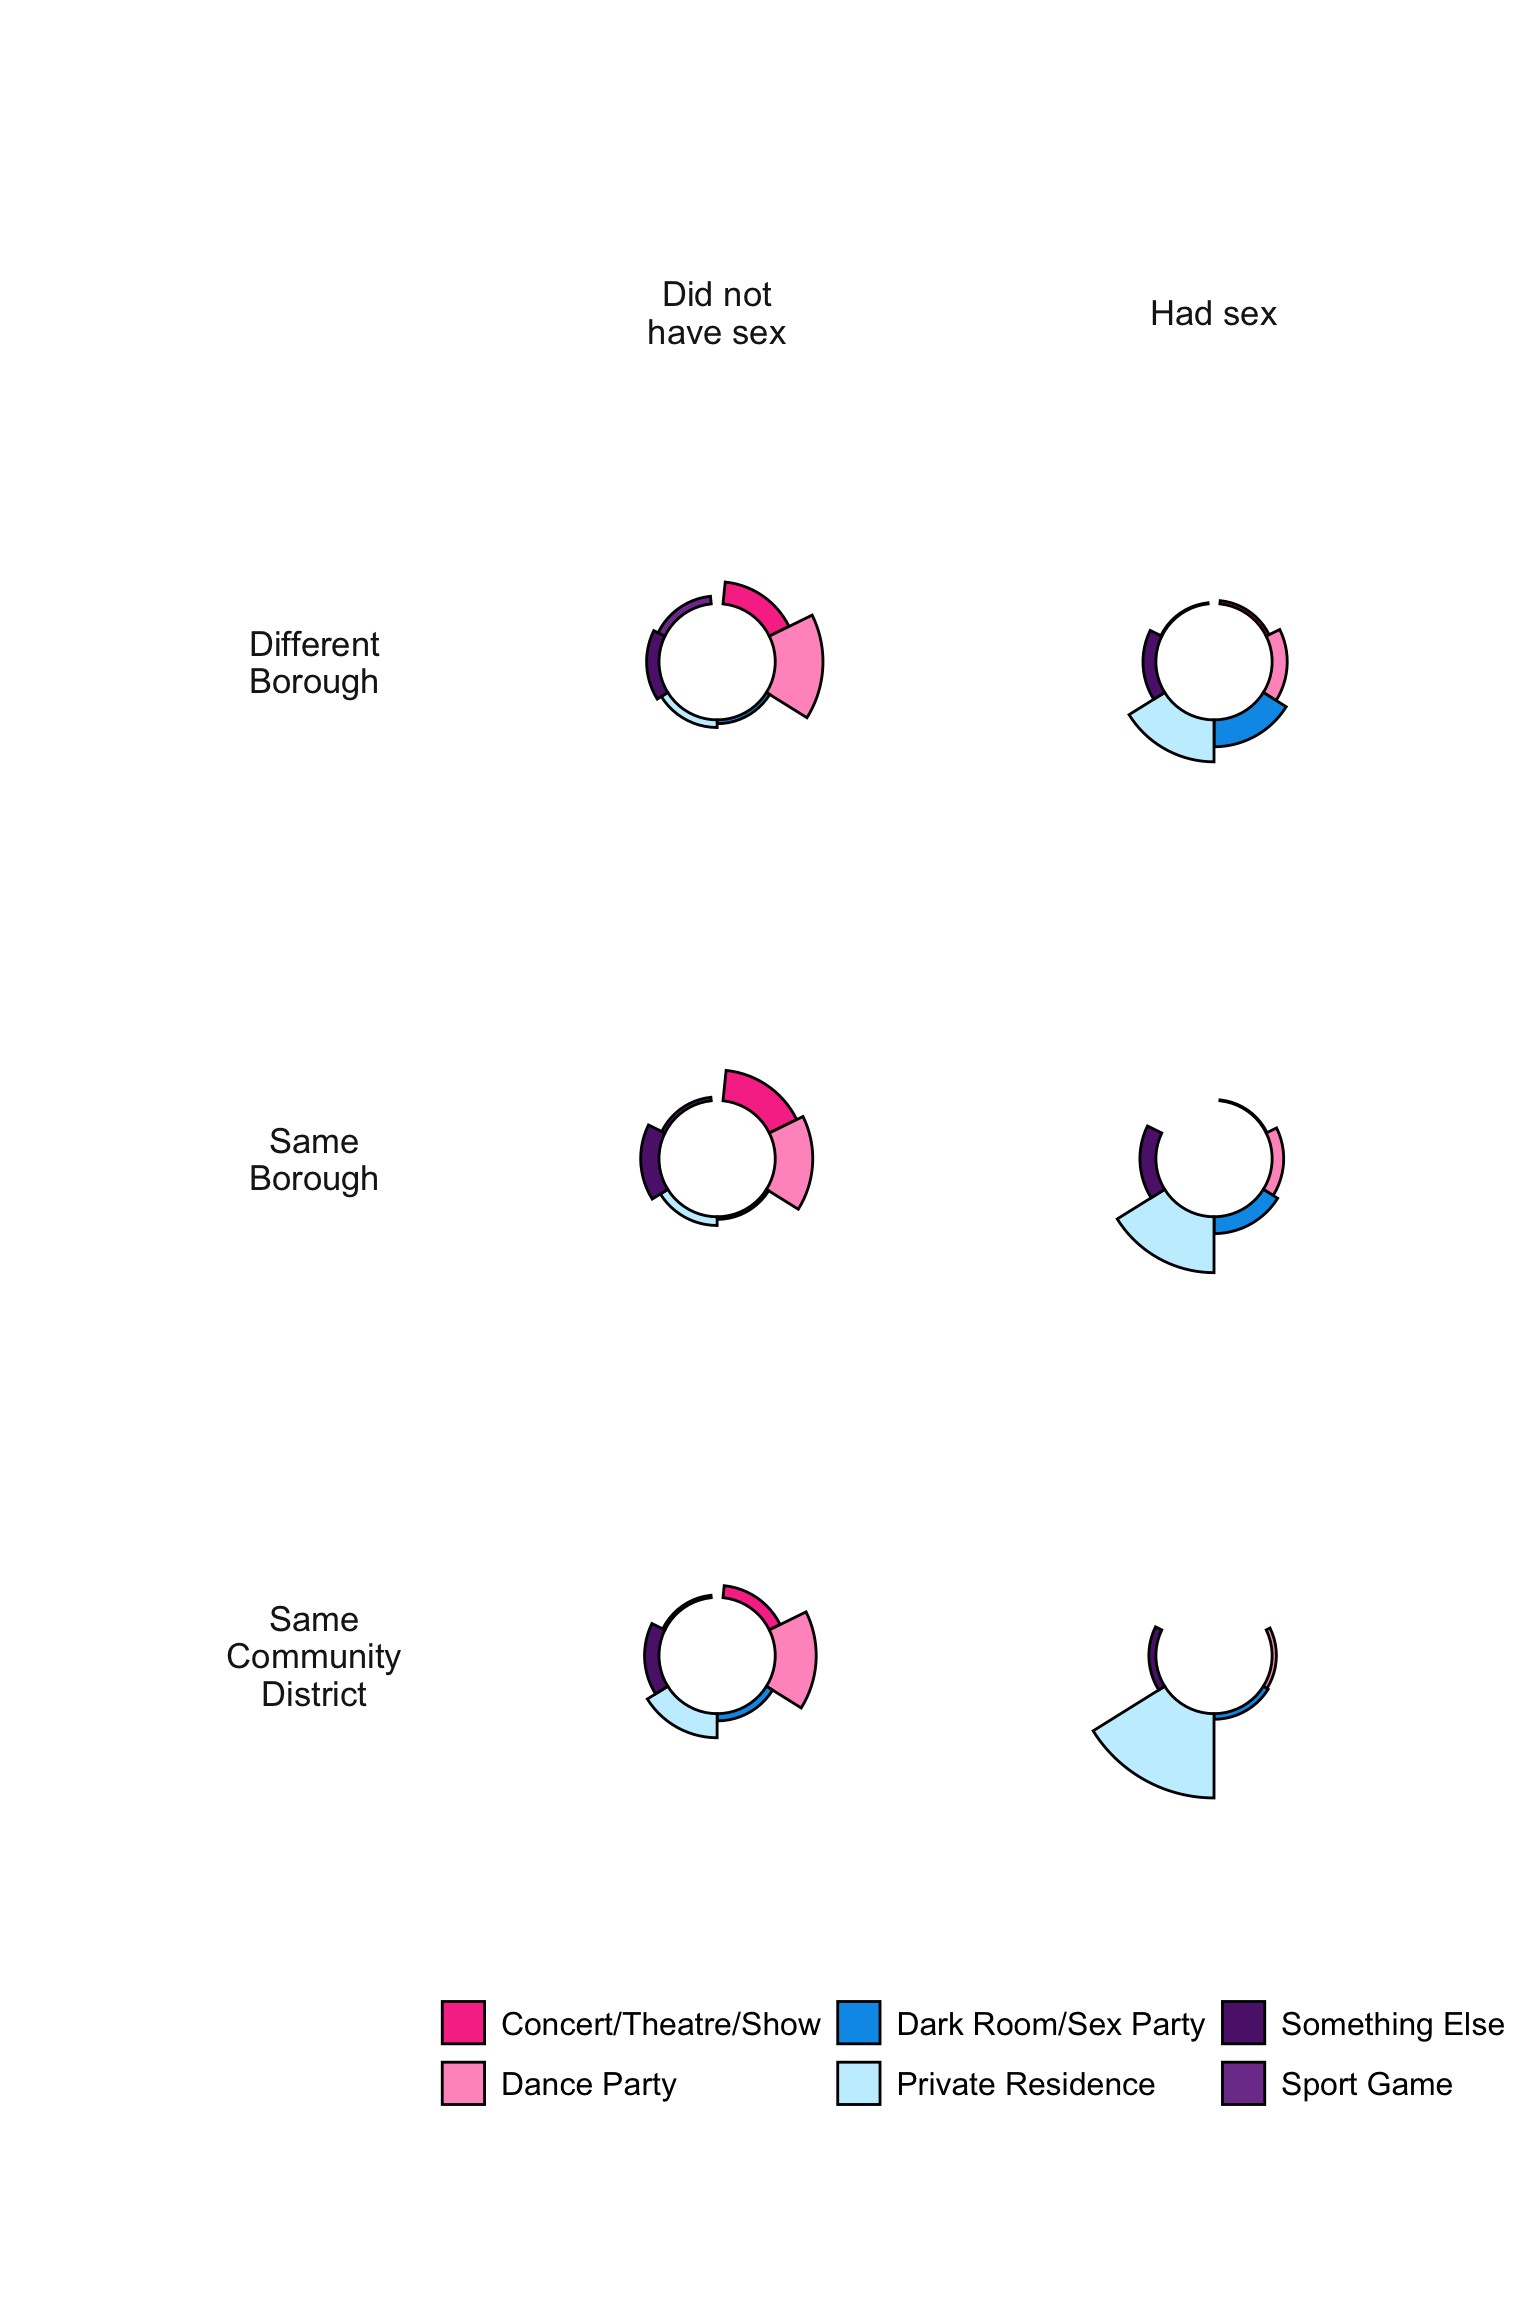
Different Borough - Did not have sex
Concert/Theatre/Show 23 22% (14-30)
Dance Party 50 47% (37-56)
Dark Room/Sex Party 4 4% (1-8)
Private Residence 8 8% (3-14)
Something Else 13 12% (6-19)
Sport Game 8 8% (3-13)
Different Borough - Had sex
Concert/Theatre/Show 3 3% (1-7)
Dance Party 14 15% (8-22)
Dark Room/Sex Party 25 27% (18-36)
Private Residence 39 41% (30-53)
Something Else 12 13% (6-21)
Sport Game 1 1% (1-4)
Same Borough - Did not have sex
Concert/Theatre/Show 35 30% (21-40)
Dance Party 43 37% (29-47)
Dark Room/Sex Party 3 3% (1-6)
Private Residence 10 9% (4-14)
Something Else 21 18% (11-26)
Sport Game 4 3% (1-7)
Same Borough - Had sex
Concert/Theatre/Show 1 1% (1-3)
Dance Party 13 11% (6-17)
Dark Room/Sex Party 19 17% (10-24)
Private Residence 63 55% (46-65)
Something Else 18 16% (10-22)
Same Community District - Did not have sex
Concert/Theatre/Show 5 12% (3-23)
Dance Party 17 40% (25-56)
Dark Room/Sex Party 3 7% (2-16)
Private Residence 10 24% (11-39)
Something Else 6 14% (5-25)
Sport Game 1 2% (2-9)
Same Community District - Had sex
Dance Party 6 4% (1-8)
Dark Room/Sex Party 8 6% (2-10)
Private Residence 120 83% (77-89)
Something Else 10 7% (3-11)

G.3 Spatial mixing

Spatial mixing coefficient by age

Code
make_plotdata_age_mixing_matrix() |>
  plot_matrix_mixing() +
  scale_fill_mpxnyc_gradient() +
  scale_color_mpxnyc_gradient() +
  theme_mpxnyc_mixing(plot.margin = ggplot2::unit(10*c(10,10,10,10), "pt"))
Figure G.1: Social mixing matrix for MPX NYC participants by age
Code
make_table_mixing_2(age) |>
 draw_table_matrix_mixing("Age")  
Age
(MPX NYC, 2022)
Ego group Alter group Coef (CI)
18-24 18-24 36% (17 to 57)
18-24 25-34 -3% (-10 to 4)
18-24 35-44 -4% (-13 to 5)
18-24 45-54 -11% (-23 to 1)
18-24 55+ -26% (-38 to -12)
25-34 18-24 -1% (-10 to 9)
25-34 25-34 11% (6 to 15)
25-34 35-44 -3% (-8 to 3)
25-34 45-54 -13% (-20 to -5)
25-34 55+ -28% (-37 to -19)
35-44 18-24 -2% (-12 to 8)
35-44 25-34 0% (-5 to 4)
35-44 35-44 13% (5 to 21)
35-44 45-54 -11% (-20 to -2)
35-44 55+ -18% (-30 to -6)
45-54 18-24 1% (-13 to 15)
45-54 25-34 -3% (-10 to 4)
45-54 35-44 -3% (-12 to 6)
45-54 45-54 23% (6 to 47)
45-54 55+ -10% (-27 to 8)
55+ 18-24 -3% (-19 to 14)
55+ 25-34 -9% (-18 to 0)
55+ 35-44 -4% (-16 to 8)
55+ 45-54 0% (-18 to 19)
55+ 55+ 65% (28 to 118)

Spatial mixing coefficient by race-Gender

Code
make_plotdata_racegender_mixing_matrix() |>
  plot_matrix_mixing() +
  scale_fill_mpxnyc_gradient() +
  scale_color_mpxnyc_gradient() +
  theme_mpxnyc_mixing()
Figure G.2: Social mixing matrices for MPX NYC participants by race-gender
Code
make_table_mixing_2(demo_group) |>
 draw_table_matrix_mixing("Race-gender")  
Race-gender
(MPX NYC, 2022)
Ego group Alter group Coef (CI)
White cisgender man White cisgender man 12% (7 to 17)
White cisgender man Latinx cisgender man -11% (-19 to -1)
White cisgender man Black cisgender man -22% (-33 to -11)
White cisgender man Transgender man 4% (-19 to 28)
White cisgender man Transgender woman -15% (-37 to 8)
White cisgender man Non binary -5% (-19 to 11)
White cisgender man Cisgender woman -10% (-23 to 3)
White cisgender man Other cisgender man -5% (-15 to 4)
White cisgender man Another demographic 26% (-16 to 81)
Latinx cisgender man White cisgender man -16% (-23 to -9)
Latinx cisgender man Latinx cisgender man 45% (25 to 69)
Latinx cisgender man Black cisgender man 8% (-11 to 28)
Latinx cisgender man Transgender man 20% (-19 to 57)
Latinx cisgender man Transgender woman -20% (-44 to 8)
Latinx cisgender man Non binary -6% (-23 to 14)
Latinx cisgender man Cisgender woman -18% (-38 to 4)
Latinx cisgender man Other cisgender man -2% (-16 to 12)
Latinx cisgender man Another demographic 30% (-21 to 93)
Black cisgender man White cisgender man -24% (-33 to -16)
Black cisgender man Latinx cisgender man 10% (-7 to 30)
Black cisgender man Black cisgender man 99% (57 to 149)
Black cisgender man Transgender man -27% (-55 to 5)
Black cisgender man Transgender woman 0% (-37 to 48)
Black cisgender man Non binary -11% (-33 to 12)
Black cisgender man Cisgender woman 5% (-26 to 39)
Black cisgender man Other cisgender man -5% (-20 to 13)
Black cisgender man Another demographic 38% (-26 to 119)
Transgender man White cisgender man -11% (-28 to 5)
Transgender man Latinx cisgender man 7% (-24 to 43)
Transgender man Black cisgender man -17% (-54 to 25)
Transgender man Transgender man 185% (20 to 477)
Transgender man Transgender woman -4% (-59 to 76)
Transgender man Non binary 56% (-1 to 124)
Transgender man Cisgender woman -34% (-65 to 8)
Transgender man Other cisgender man -15% (-40 to 13)
Transgender man Another demographic 12% (-50 to 98)
Transgender woman White cisgender man -10% (-27 to 5)
Transgender woman Latinx cisgender man -8% (-33 to 20)
Transgender woman Black cisgender man 13% (-31 to 67)
Transgender woman Transgender man -4% (-59 to 71)
Transgender woman Transgender woman 117% (2 to 322)
Transgender woman Non binary 18% (-28 to 68)
Transgender woman Cisgender woman -6% (-51 to 56)
Transgender woman Other cisgender man -5% (-31 to 25)
Transgender woman Another demographic 62% (-32 to 205)
Non binary White cisgender man -9% (-18 to 0)
Non binary Latinx cisgender man -11% (-27 to 5)
Non binary Black cisgender man -19% (-38 to 1)
Non binary Transgender man 50% (-1 to 108)
Non binary Transgender woman 6% (-35 to 53)
Non binary Non binary 77% (39 to 125)
Non binary Cisgender woman -10% (-37 to 24)
Non binary Other cisgender man 3% (-16 to 23)
Non binary Another demographic 27% (-25 to 92)
Cisgender woman White cisgender man -3% (-15 to 8)
Cisgender woman Latinx cisgender man -5% (-26 to 19)
Cisgender woman Black cisgender man 1% (-28 to 31)
Cisgender woman Transgender man -15% (-54 to 40)
Cisgender woman Transgender woman -18% (-56 to 32)
Cisgender woman Non binary -3% (-29 to 28)
Cisgender woman Cisgender woman 89% (34 to 164)
Cisgender woman Other cisgender man -16% (-33 to 4)
Cisgender woman Another demographic 48% (-35 to 150)
Other cisgender man White cisgender man -6% (-13 to 0)
Other cisgender man Latinx cisgender man -4% (-17 to 8)
Other cisgender man Black cisgender man -3% (-19 to 14)
Other cisgender man Transgender man -2% (-34 to 34)
Other cisgender man Transgender woman -19% (-40 to 5)
Other cisgender man Non binary 2% (-16 to 23)
Other cisgender man Cisgender woman -16% (-35 to 5)
Other cisgender man Other cisgender man 30% (13 to 52)
Other cisgender man Another demographic 27% (-12 to 73)
Another demographic White cisgender man -3% (-21 to 12)
Another demographic Latinx cisgender man -6% (-32 to 24)
Another demographic Black cisgender man 2% (-37 to 55)
Another demographic Transgender man -1% (-60 to 88)
Another demographic Transgender woman -21% (-62 to 31)
Another demographic Non binary -9% (-39 to 27)
Another demographic Cisgender woman -13% (-56 to 55)
Another demographic Other cisgender man 2% (-24 to 34)
Another demographic Another demographic 174% (-8 to 648)

Spatial mixing coefficient by sexual orientation

Code
make_plotdata_sexorientation_mixing_matrix() |>
  plot_matrix_mixing() +
  scale_fill_mpxnyc_gradient() +
  scale_color_mpxnyc_gradient() +
  theme_mpxnyc_mixing(plot.margin = ggplot2::unit(10*c(10,10,10,10), "pt")) 
Figure G.3: Social mixing matrix for MPX NYC participants by sexual orientation
Code
make_table_mixing_2(sexOrientation) |>
 draw_table_matrix_mixing("Sexual orientation")  
Sexual orientation
(MPX NYC, 2022)
Ego group Alter group Coef (CI)
Gay Gay 3% (0 to 5)
Gay Bisexual -7% (-14 to 0)
Gay Straight -16% (-31 to 2)
Gay Queer 3% (-5 to 12)
Gay Something Else -15% (-31 to 0)
Bisexual Gay -5% (-9 to -1)
Bisexual Bisexual 25% (9 to 44)
Bisexual Straight 0% (-29 to 34)
Bisexual Queer 0% (-13 to 14)
Bisexual Something Else -14% (-41 to 15)
Straight Gay -6% (-14 to 1)
Straight Bisexual 2% (-20 to 26)
Straight Straight 103% (19 to 223)
Straight Queer -9% (-33 to 16)
Straight Something Else -4% (-56 to 75)
Queer Gay -3% (-7 to 1)
Queer Bisexual -8% (-21 to 4)
Queer Straight -22% (-44 to 3)
Queer Queer 42% (25 to 61)
Queer Something Else -30% (-55 to -1)
Something Else Gay -8% (-20 to 4)
Something Else Bisexual 2% (-30 to 35)
Something Else Straight -5% (-52 to 62)
Something Else Queer -11% (-43 to 26)
Something Else Something Else 245% (16 to 625)